
Technical GIS Case Study
A GIS-based assessment of healthcare facility distribution, population-relative facility availability, settlement accessibility, underserved settlements, and healthcare intervention priority across Kaduna State, Nigeria.
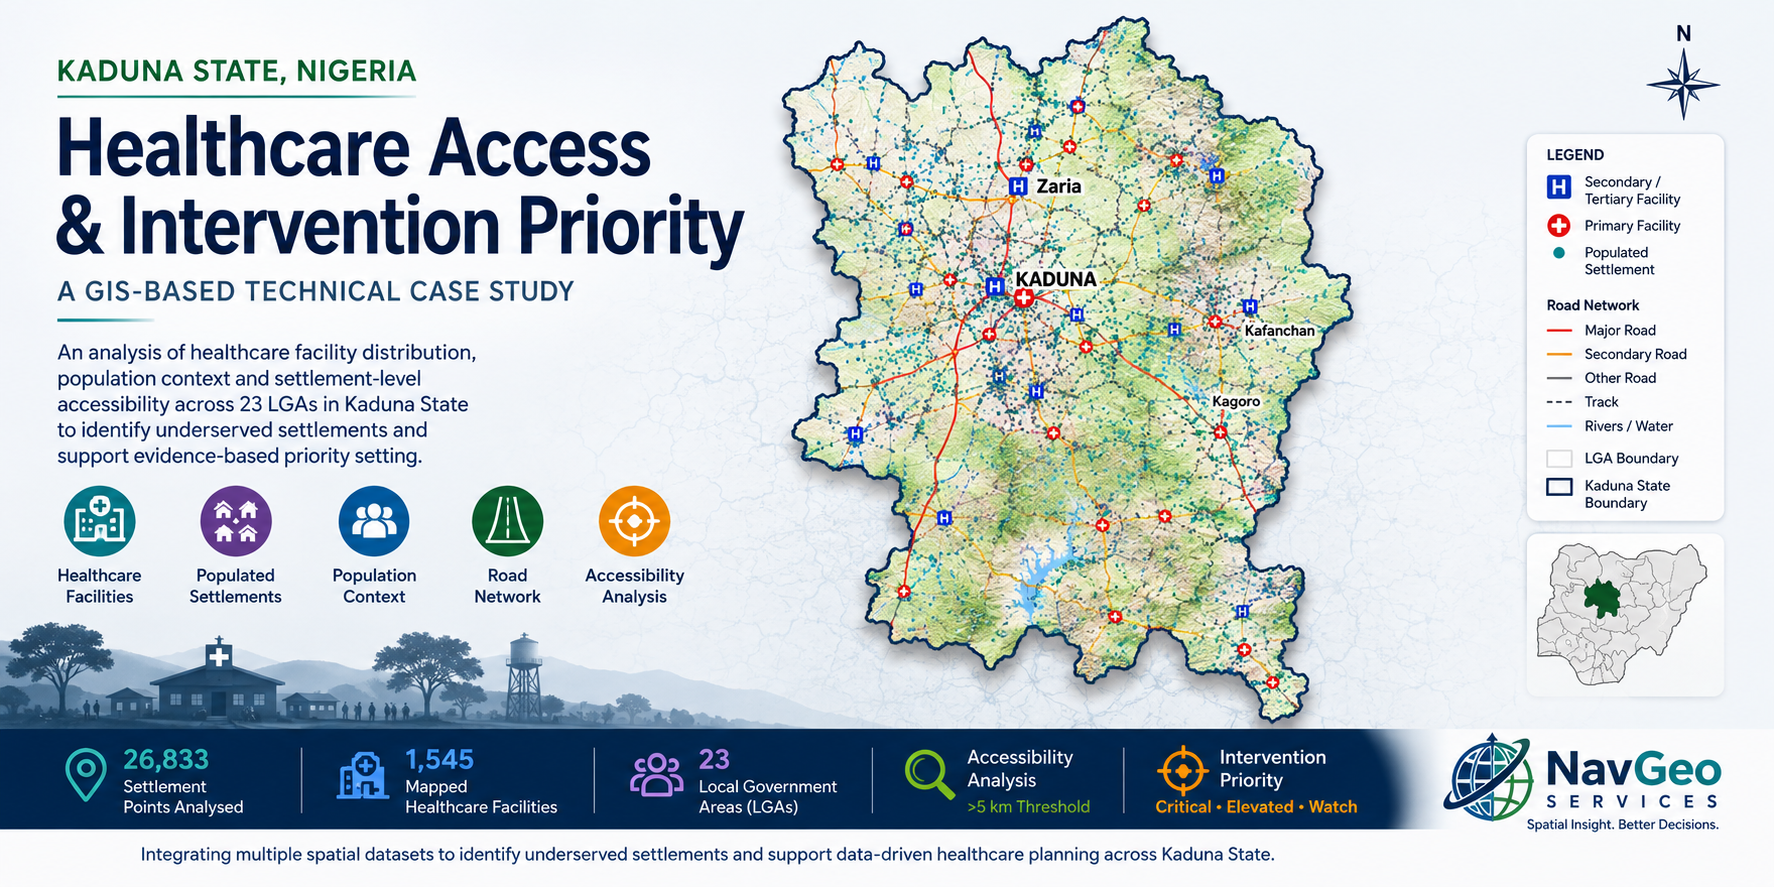
Project Information
| Study Area | Kaduna State, Nigeria |
| Administrative Coverage | 23 Local Government Areas |
| Healthcare Facilities Analysed | 1,545 |
| Settlement Points Analysed | 26,833 |
| Analytical Components | A1–A10 |
| GIS Environment | ArcGIS Pro 3.4 |
| Project Type | Health GIS / Spatial Accessibility Analysis |
| Project | NavGeo Services Showcase 1 |
| Interactive StoryMap | Healthcare Accessibility & Intervention Priority Analysis |
| Technical Publication | Healthcare Accessibility & Intervention Priority Analysis: Kaduna State, Nigeria — DOI: 10.5281/zenodo.22145459 |
01 — Study Overview
This technical case study examines the spatial distribution of healthcare facilities and settlement-level healthcare accessibility across Kaduna State, Nigeria. The analysis combines healthcare facility locations, settlement locations, population data, administrative boundaries, and road-network data to examine geographic differences in healthcare access and identify areas requiring closer analytical attention.
Healthcare facility distribution was first examined at LGA level, followed by population-relative indicators measuring healthcare facilities per 100,000 population and population per healthcare facility. Settlement accessibility was then assessed using distance to the nearest mapped healthcare facility.
Settlements were classified into Very Good, Good, Limited, Poor, and Very Poor healthcare accessibility classes. The analysis identified 2,857 settlements in the Limited, Poor, or Very Poor classes. These settlements formed the underserved-settlement dataset used for the subsequent healthcare intervention-priority analysis.
The intervention-priority analysis classified the 2,857 underserved settlements into 307 Critical, 1,655 Elevated, and 895 Watch settlements. The Critical settlements were subsequently examined using population-normalized measures, nearest-healthcare-facility relationships, facility-concentration analysis, and road proximity and road-class information.
The complete analysis consists of ten analytical components, A1–A10, progressing from healthcare facility distribution and population-relative availability through settlement accessibility, underserved-settlement identification and intervention priority, followed by detailed analysis of the Critical settlements.
GIS processing included dataset preparation and standardization, attribute review, spatial joins, nearest-feature analysis, distance-based classification, population normalization, LGA-level aggregation, multi-indicator classification, statistical summarization, QA/QC, and cartographic production.
02 — Data Sources
The analysis used multiple spatial datasets representing administrative boundaries, healthcare facilities, settlements, population, and roads. Datasets were selected according to their relevance to the analytical requirements of the study and were reviewed before inclusion in the working geodatabase.
The principal data sources included GRID3 Nigeria datasets, geoBoundaries administrative boundary data, and supporting administrative reference data. Each dataset was assigned a defined analytical role, with some datasets retained as primary working inputs and others used for reference, comparison, or validation.
Principal Analytical Datasets
| Dataset | Data Type | Role in the Analysis |
|---|---|---|
| Kaduna LGA Boundaries | Polygon | LGA-level aggregation, population linkage, accessibility summaries, priority analysis and thematic mapping |
| Healthcare Facilities | Point | Facility distribution, facility counts, nearest-facility analysis and healthcare accessibility assessment |
| Settlement Locations | Point | Settlement-level accessibility analysis and identification of underserved settlements |
| Population Data | Polygon / attribute data | LGA population estimates and population-normalized healthcare indicators |
| Road Network | Line | Road proximity and road-type context for Critical settlements |
The healthcare facility dataset provided the mapped facility locations and associated attributes used throughout the analysis. Relevant attributes included facility level, facility type, ownership information, geographic location, and administrative association.
Settlement data provided the locations used for settlement-level accessibility calculations. These locations formed the basis for measuring proximity to mapped healthcare facilities and for identifying settlements falling within the defined accessibility classes.
Population data were used at LGA level to calculate population-relative indicators. These included healthcare facilities per 100,000 population, population per healthcare facility, and, later in the analysis, Critical settlements per 100,000 population.
Road-network data were introduced during the detailed analysis of Critical settlements. The road data supported measurements of distance to the nearest mapped road and classification of the corresponding nearest road type.
Administrative boundary datasets provided the spatial framework for organizing, summarizing, and mapping results across the 23 LGAs of Kaduna State.
Dataset Roles
The project distinguished between datasets used directly in analytical calculations and datasets retained primarily for reference or validation. This distinction helped maintain a controlled analytical workflow and avoided treating every acquired dataset as an equivalent analytical input.
The original downloaded datasets were preserved separately from prepared working datasets. Data preparation, field standardization, administrative-name checks, spatial alignment, and other required processing were completed before the datasets were used in the A1–A10 analytical workflow.
Data Provenance
Dataset source information, acquisition details, intended use, processing status, and relevant observations were recorded during the project. The complete provenance and processing records are maintained in the internal Data Source Register and Processing Log.
03 — Data Preparation & QA/QC
Before spatial analysis, the source datasets were reviewed and prepared to establish a consistent working data structure. Preparation included inspection of geometry, coordinate systems, attribute fields, administrative identifiers, completeness, and dataset suitability for the planned analytical components.
Original downloaded datasets were preserved separately from the prepared working data. Processing was performed on controlled working copies so that source data remained available for reference and comparison throughout the project.
Data Preparation Workflow
The principal preparation activities included:
| Preparation Activity | Purpose |
|---|---|
| Dataset Review | Examine geometry, attributes, metadata, coverage, and suitability for the planned analysis |
| Coordinate System Review | Confirm spatial reference information and establish a consistent working coordinate system |
| Attribute Review | Examine relevant fields, values, blanks, classifications, and data types |
| Administrative Name Review | Check State, LGA, and Ward naming fields for consistency and matching requirements |
| Field Standardization | Retain, create, or standardize fields required for subsequent analysis |
| Spatial Alignment | Confirm that datasets from different sources aligned appropriately within the study area |
| Working Dataset Preparation | Prepare analysis-ready feature classes while preserving the original source datasets |
| Validation | Check prepared outputs before their use in the A1–A10 analytical workflow |
Coordinate System
Spatial analysis requiring distance or area measurements was conducted using WGS 1984 UTM Zone 32N (EPSG:32632). The projected coordinate system provided a consistent metric framework for the Kaduna State analysis.
Source datasets were reviewed for their original spatial references before preparation. Required transformations or reprojections were applied to working datasets as part of the standardization process.
Attribute and Administrative Review
Attribute structures were examined before analytical fields were selected or created. Particular attention was given to fields representing administrative areas, healthcare facility characteristics, settlement classifications, population information, and road attributes required later in the workflow.
Administrative-name fields from different datasets were also compared because equivalent geographic units were not always represented through identical field structures or naming conventions. Where required, standardized fields were used to support reliable joins, aggregation, and LGA-level reporting.
The review also identified blank values, alternative administrative names, differences between comparable fields, and attributes that were useful for reference but were not required in the final analytical workflow.
Healthcare Facility Preparation
Healthcare facility records were reviewed for the attributes required by the analysis, including facility level, facility type, ownership, geographic location, and administrative association.
Facility coordinates and spatial locations were checked before the dataset was used for facility-distribution summaries and nearest-facility analysis. Analytical classifications were based on the values retained in the prepared healthcare facility dataset.
Settlement and Population Preparation
Settlement locations were prepared for settlement-level distance analysis and subsequent accessibility classification. Relevant settlement attributes were retained to support identification, aggregation, and reporting of analytical outputs.
Population information was prepared at LGA level and linked to the corresponding administrative units. These values were subsequently used to calculate population-relative healthcare indicators and the population-normalized Critical-settlement indicator.
Road-Network Preparation
Road data were prepared for the later analysis of Critical settlements. Relevant road attributes were retained to support nearest-road distance calculations and road-type classification.
The road dataset was used as a mapped spatial reference for proximity and road-type context. No assumption was made during preparation that mapped road class represented road condition, travel speed, seasonal accessibility, or passability.
QA/QC Controls
QA/QC was applied throughout data preparation and continued during the analytical workflow. Checks included spatial-reference verification, attribute review, administrative matching, output-count checks, calculation review, classification verification, and comparison of analytical outputs with their source datasets.
Processing decisions, identified data issues, and relevant resolutions were recorded during the project. The detailed records remain in the internal Processing Log and Issue Log, while the technical case study presents the preparation steps that directly support interpretation of the published analysis.
04 — Analytical Framework
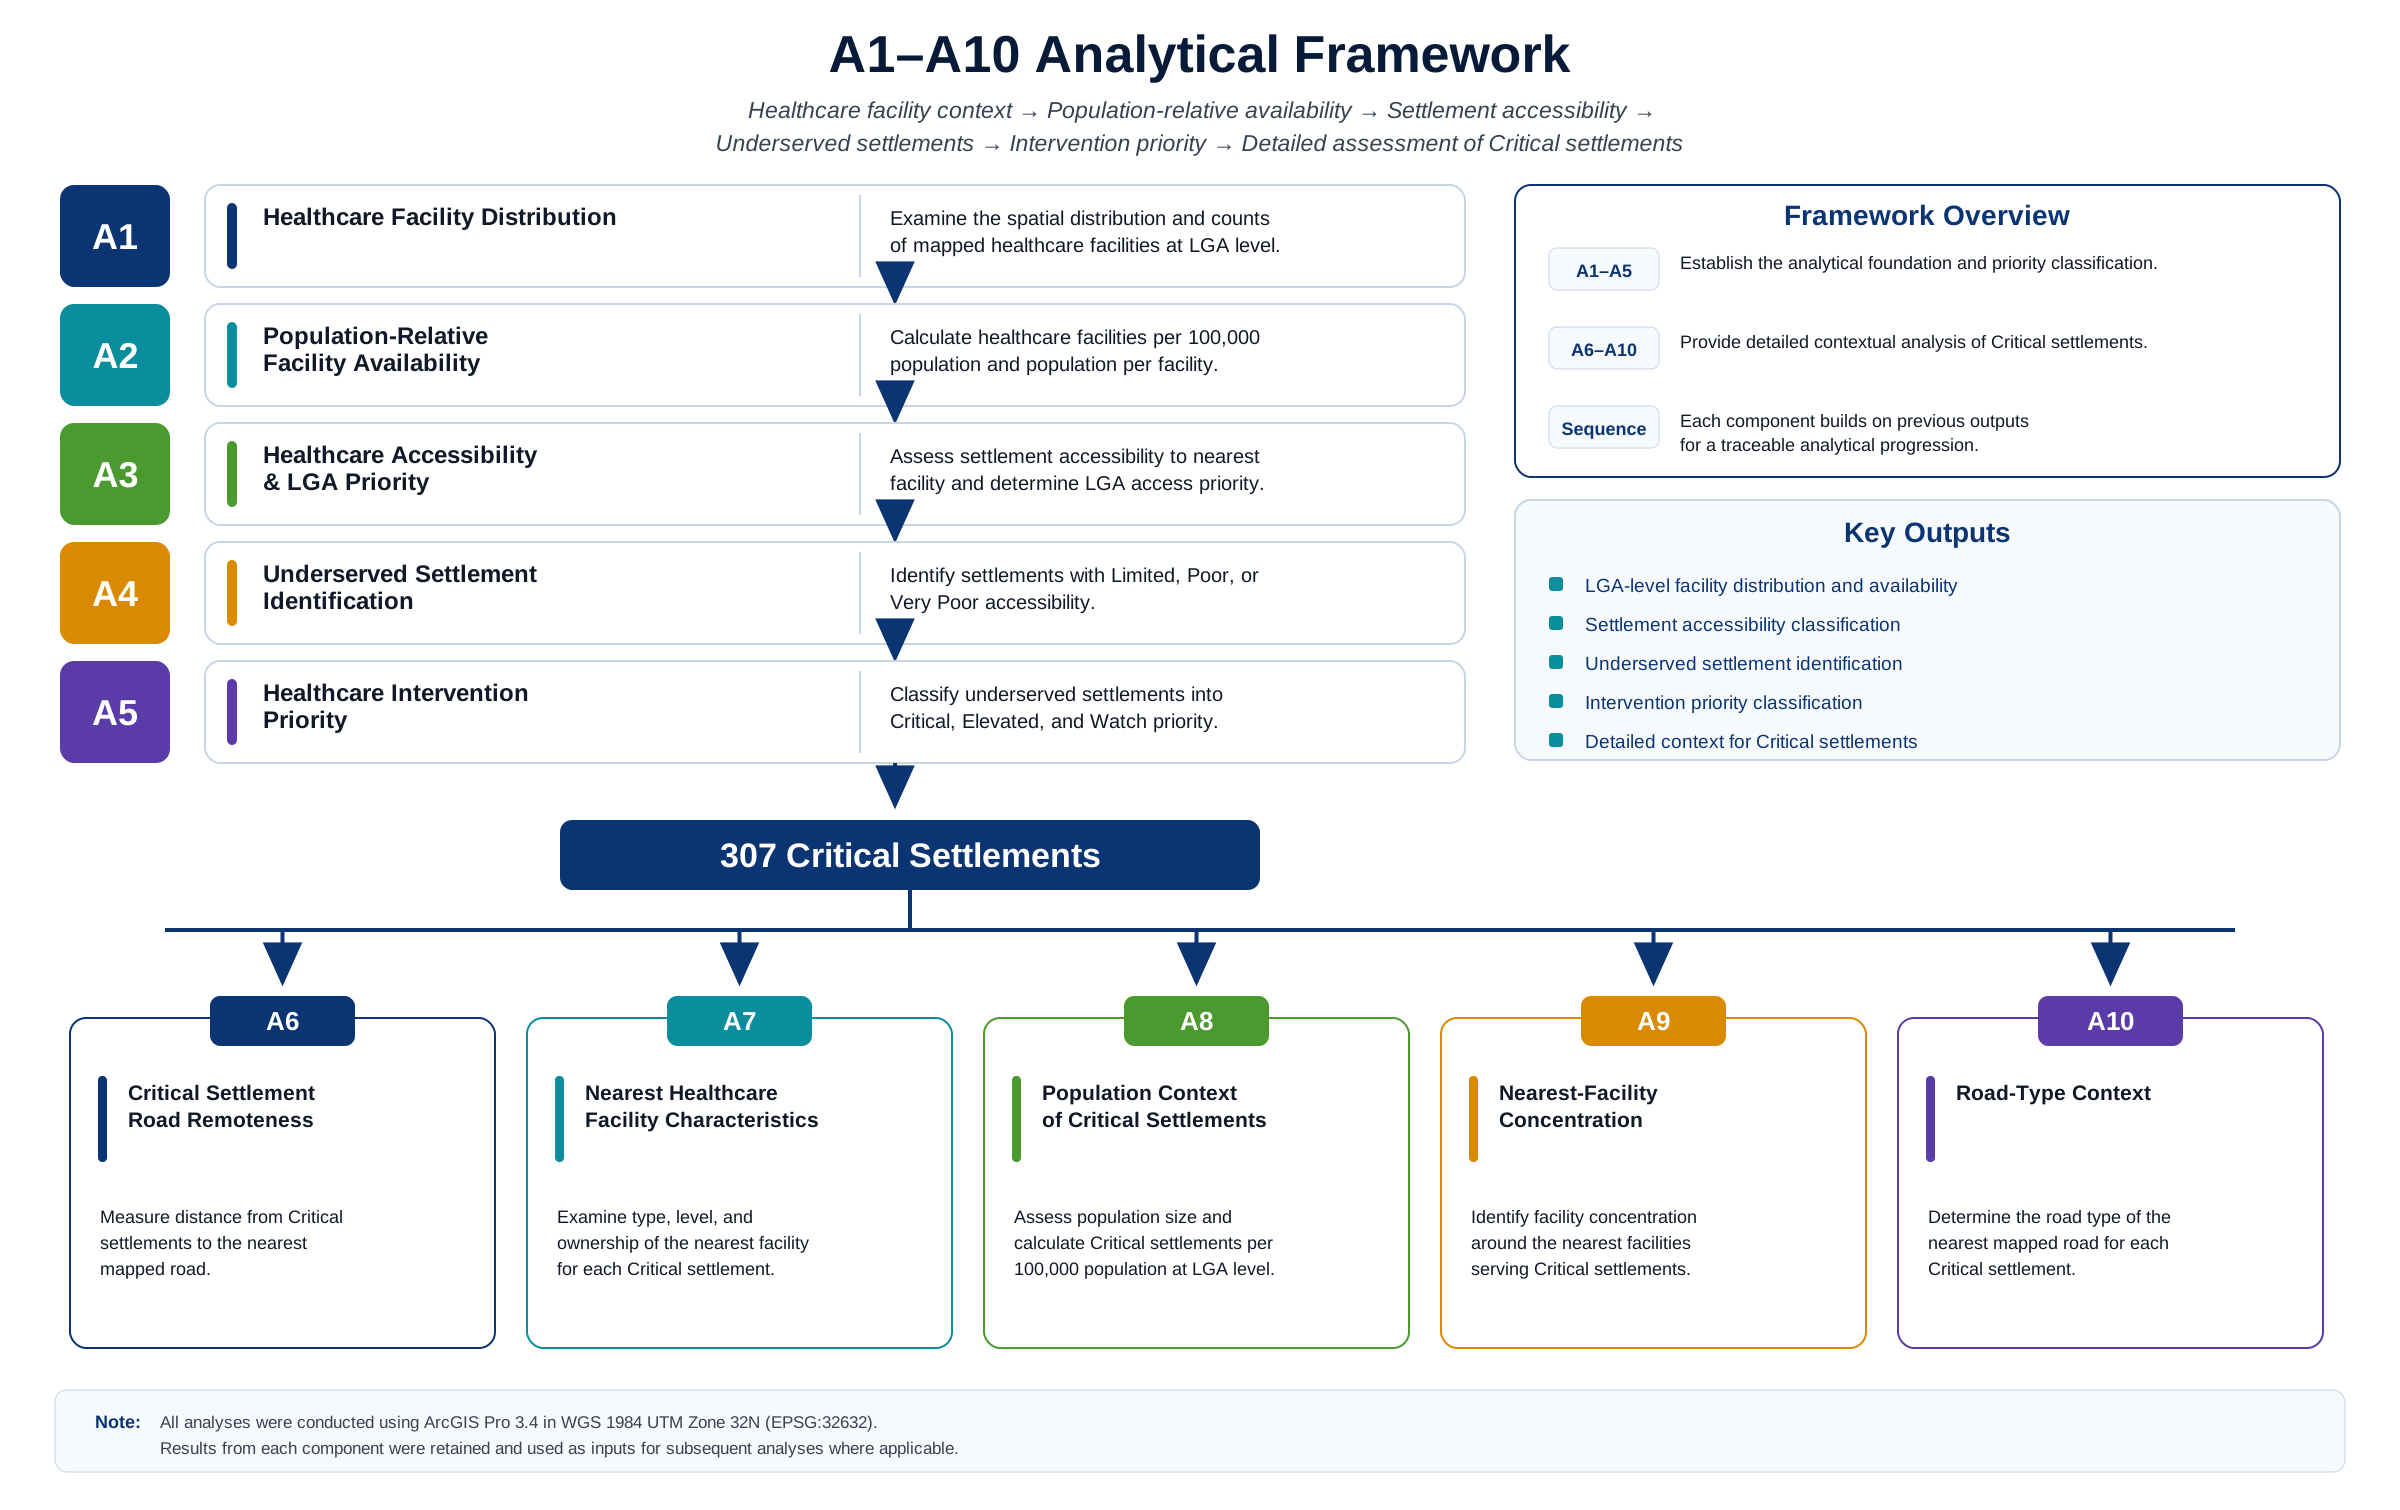
The analytical framework was organized into ten sequential components (A1–A10). The workflow begins with examination of healthcare facility distribution and population-relative facility availability, then progresses to settlement-level healthcare accessibility, identification of underserved settlements, and healthcare intervention-priority classification.
The first five components establish the principal analytical sequence. A1 and A2 examine healthcare facility distribution and availability, A3 assesses settlement accessibility and LGA-level access priority, A4 identifies underserved settlements, and A5 integrates the relevant indicators to classify healthcare intervention priority.
The analysis identified 307 Critical settlements at A5. These settlements became the focus of A6–A10, which examine road remoteness, characteristics of the nearest mapped healthcare facilities, population context, concentration around nearest facilities, and road-type context.
A1–A10 Analytical Sequence
| Component | Analytical Focus |
|---|---|
| A1 | Healthcare Facility Distribution |
| A2 | Population-Relative Facility Availability |
| A3 | Healthcare Accessibility & LGA Priority |
| A4 | Underserved Settlement Identification |
| A5 | Healthcare Intervention Priority |
| A6 | Critical Settlement Road Remoteness |
| A7 | Nearest Healthcare Facility Characteristics |
| A8 | Population Context of Critical Settlements |
| A9 | Nearest-Facility Concentration |
| A10 | Road-Type Context |
The analytical sequence can be summarized as:
Healthcare facility context → Population-relative availability → Settlement accessibility → Underserved settlements → Intervention priority → Detailed assessment of Critical settlements
Results from each component were retained as analytical outputs and used as inputs to subsequent components where required. This maintained a traceable progression from the source datasets to the final settlement-level and LGA-level findings.
05 — A1: Healthcare Facility Distribution
Analytical Question
A1 examined the distribution and characteristics of mapped healthcare facilities across Kaduna State.
The analysis addressed three questions:
- How are the mapped healthcare facilities distributed across the 23 LGAs?
- What facility types make up the mapped healthcare system?
- What ownership pattern is recorded in the healthcare facility dataset?
Method
The prepared healthcare facility dataset was summarized by LGA and by selected facility attributes. Facility counts were calculated for each LGA, and frequency analysis was applied to the facility-type and ownership fields.
The analysis used the prepared dataset of 1,545 mapped healthcare facilities. Each facility retained its geographic location and administrative association, allowing the attribute summaries to be linked directly to the spatial distribution shown on the maps.
A1 established the facility baseline used by the later population-relative and accessibility analyses.
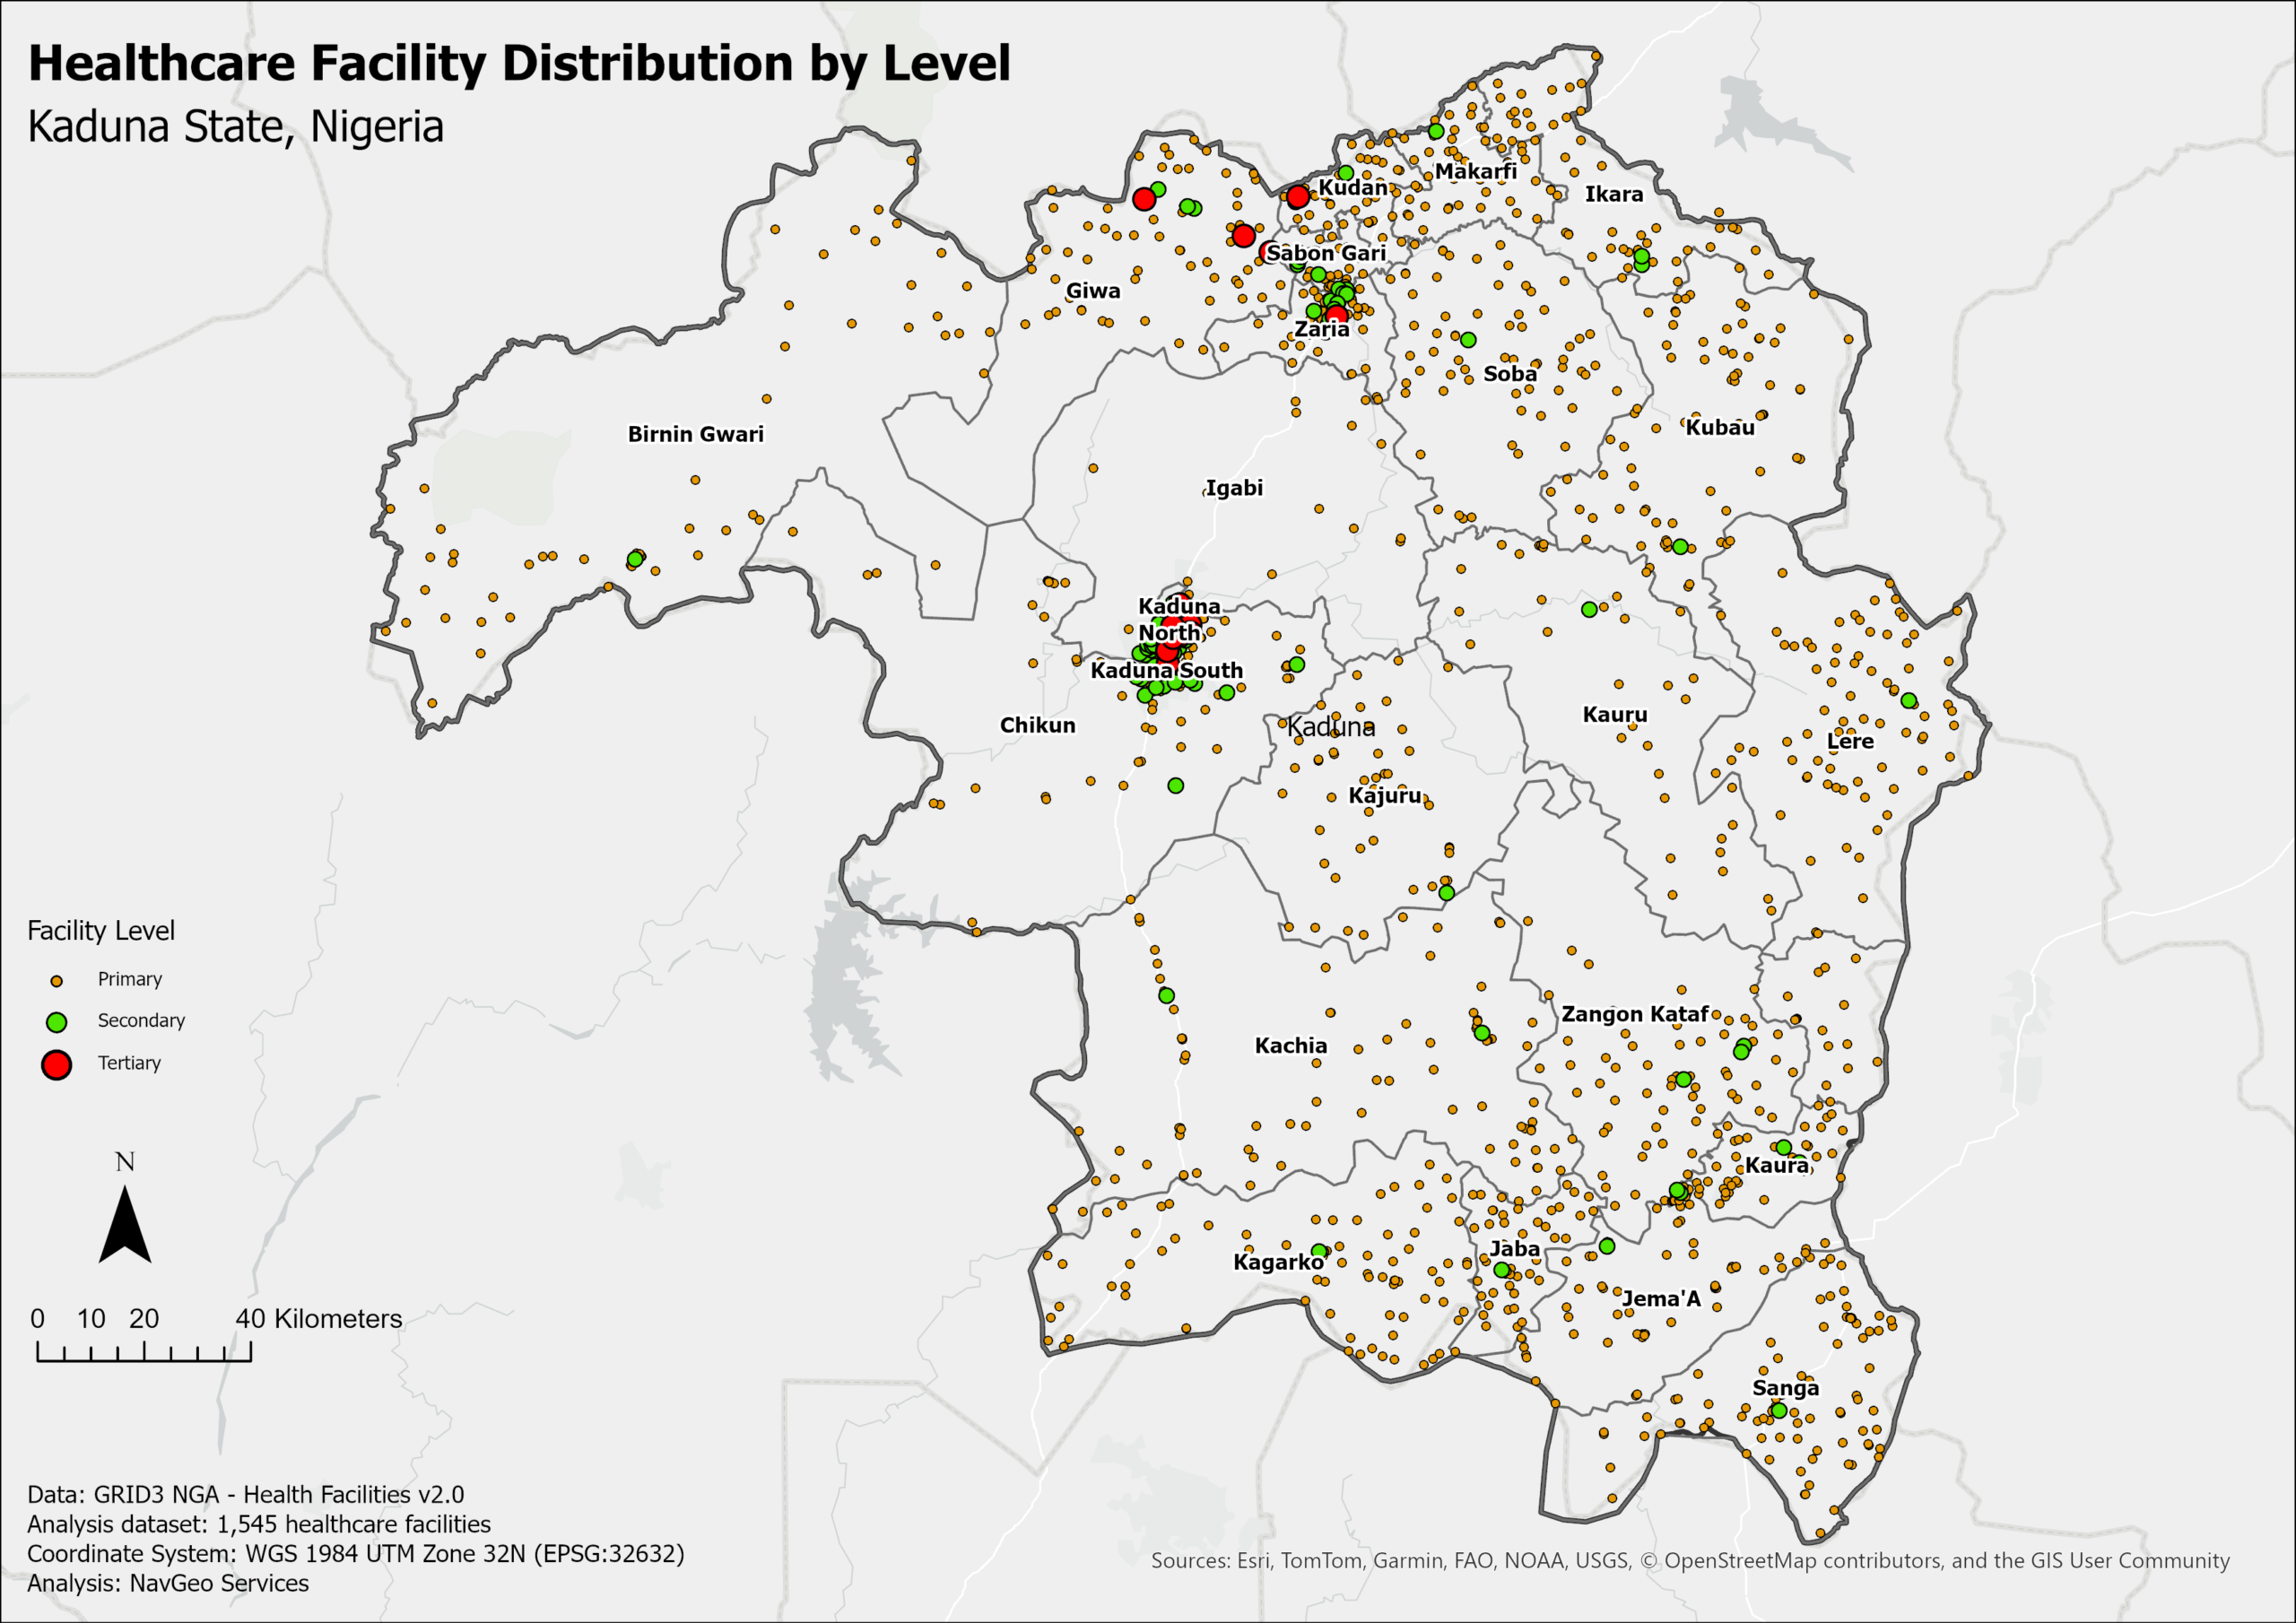
Mapped facilities analyzed: 1,545 across 23 LGAs.
Healthcare Facilities by LGA
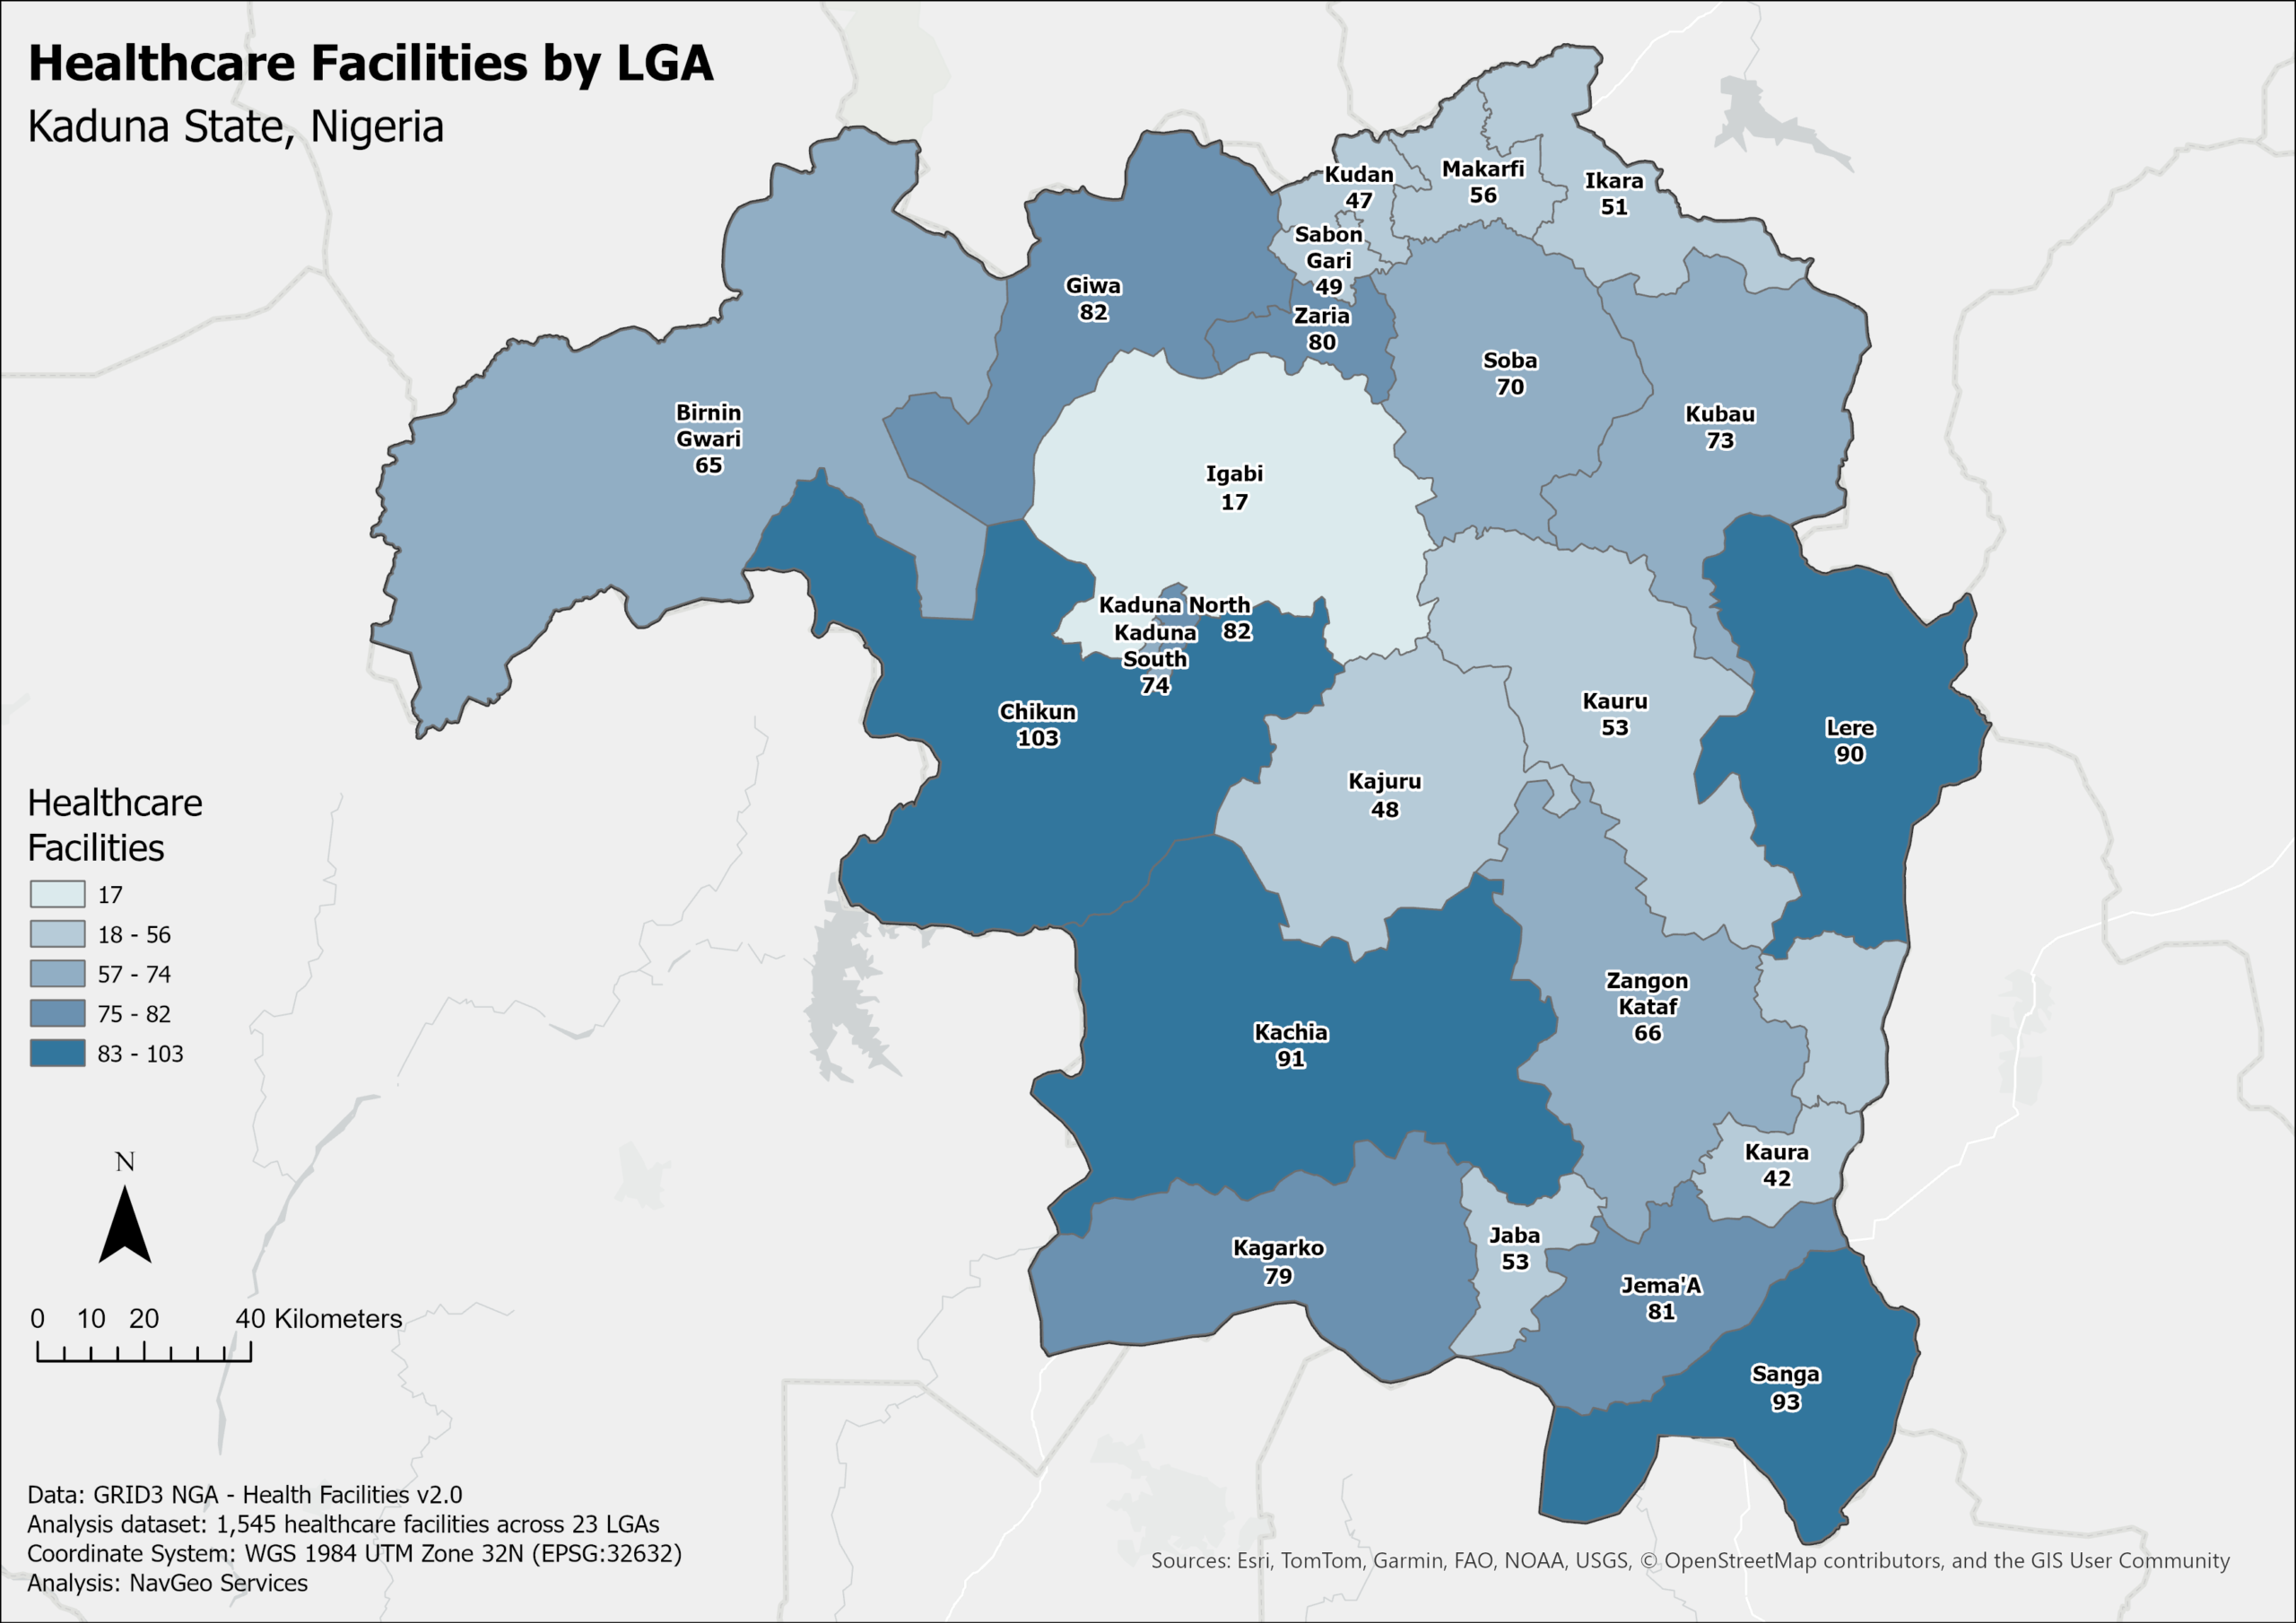
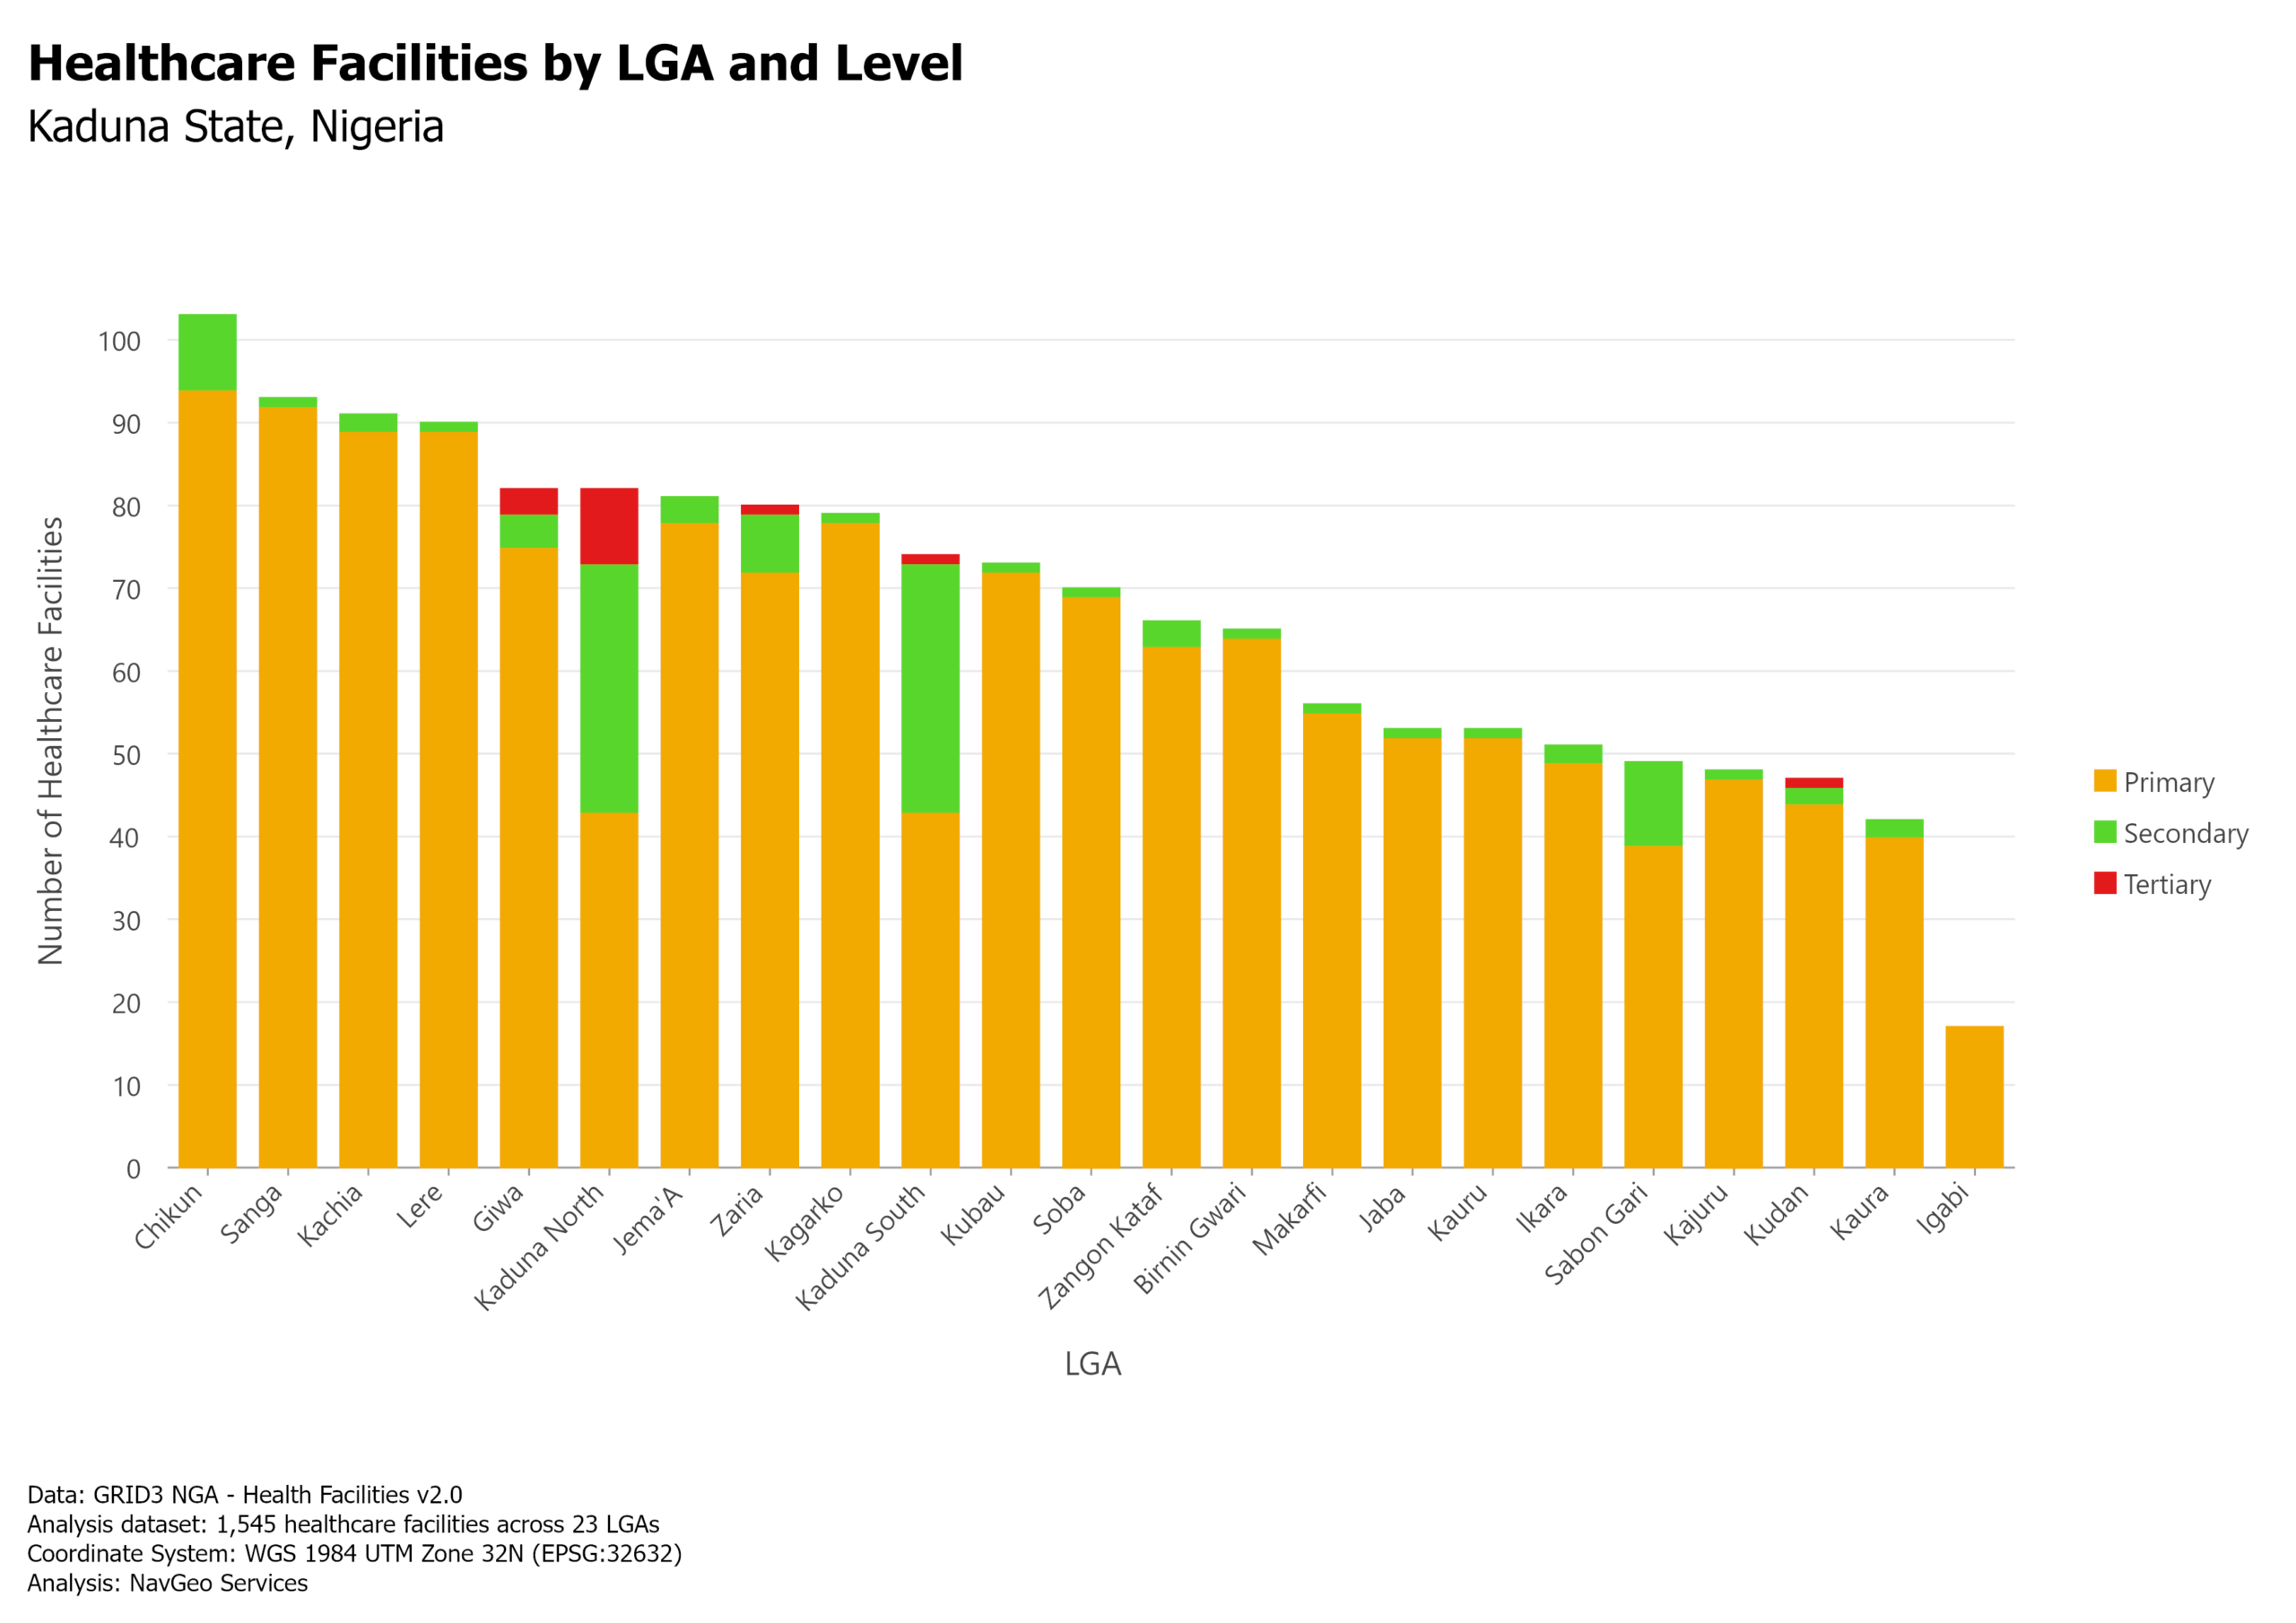
The 1,545 mapped healthcare facilities are distributed across all 23 LGAs, with substantial differences in facility counts.
Chikun records the highest number of mapped healthcare facilities with 103, followed by Sanga with 93, Kachia with 91, and Lere with 90.
At the lower end of the distribution, Igabi records 17 mapped healthcare facilities, the lowest count among the 23 LGAs.
The LGA counts provide an absolute measure of mapped facility availability. Population is not incorporated at this stage; population-relative availability is examined separately under A2.
Healthcare Facility Type
Primary-level facility types account for most records in the healthcare facility dataset.
| Facility Type | Facilities | Share of Total |
|---|---|---|
| Primary Health Clinic | 737 | 47.7% |
| Primary Health Center | 501 | 32.4% |
| Health Post | 153 | 9.9% |
| Unknown | 138 | 8.9% |
| General Hospital | 10 | 0.6% |
| Teaching/Tertiary Hospital | 5 | 0.3% |
| Specialized Hospital | 1 | 0.1% |
| Total | 1,545 | 100.0% |
Primary Health Clinics, Primary Health Centers, and Health Posts together account for 1,391 facilities, equal to 90.0% of the mapped facility dataset.
This facility-type composition provides important context for the later nearest-facility analysis of Critical settlements.

Healthcare Facility Ownership
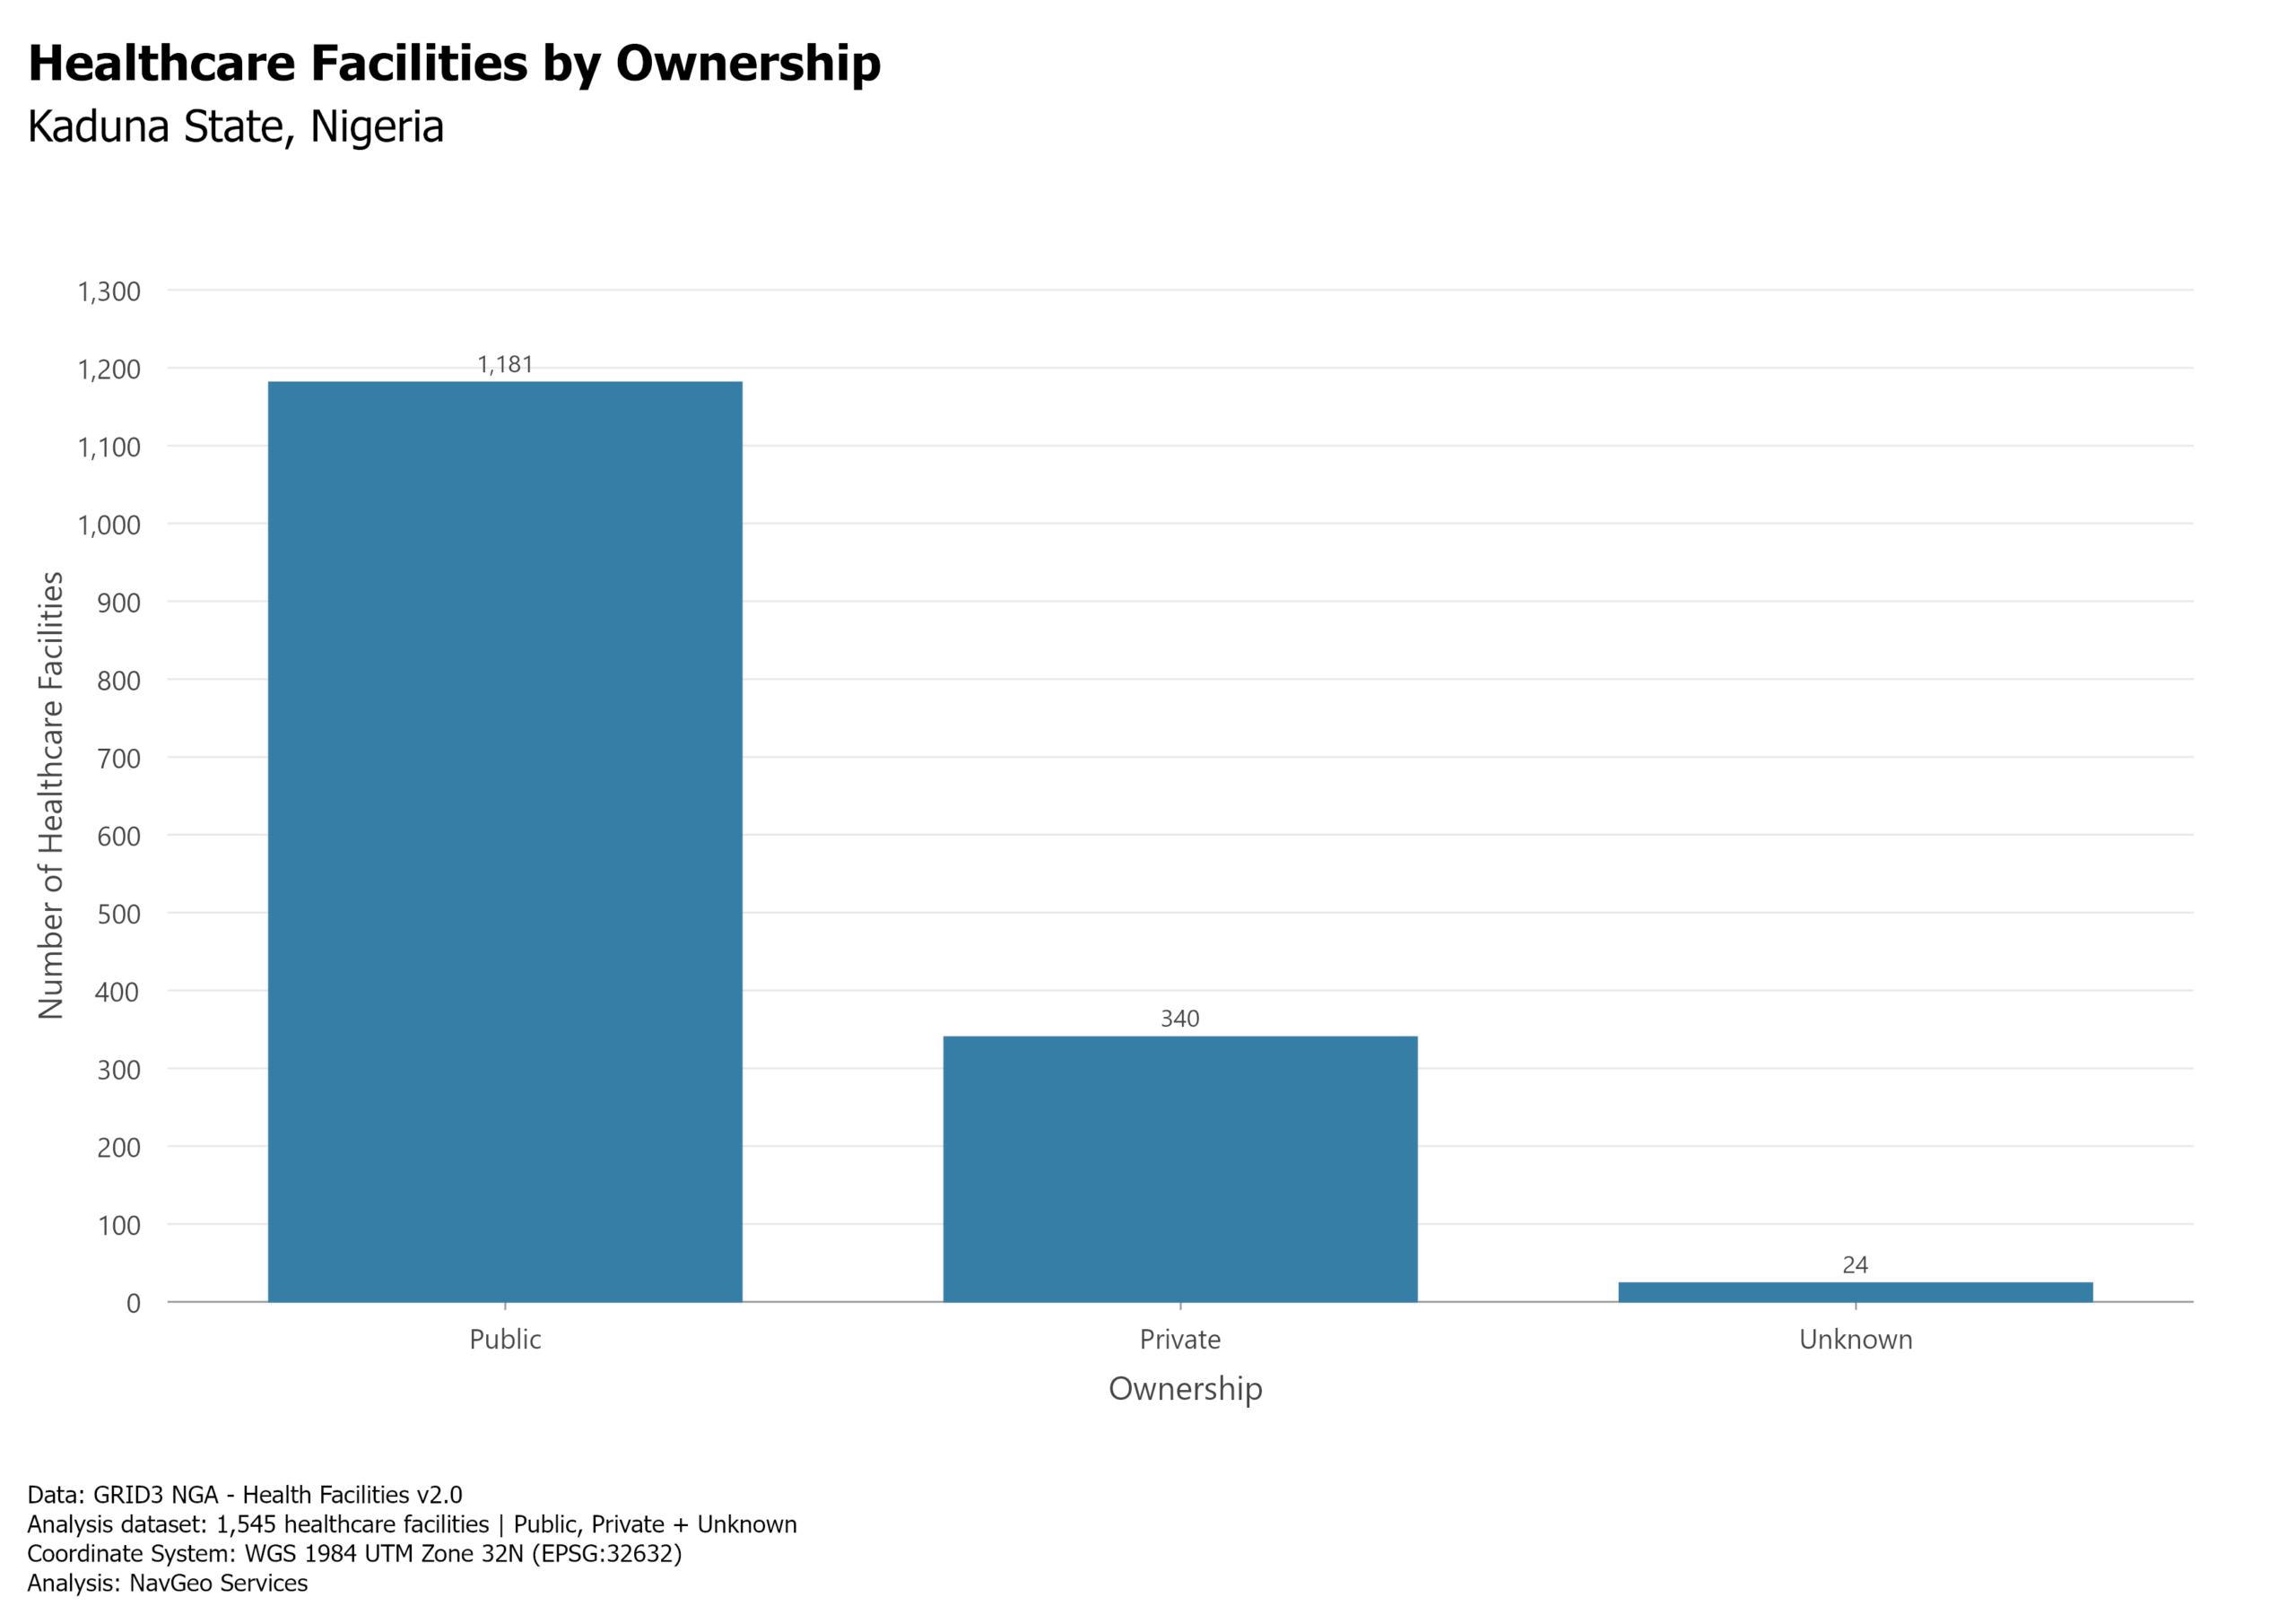
The ownership field records 1,181 Public facilities, 340 Private facilities, and 24 facilities with Unknown ownership.
| Ownership | Facilities | Share |
|---|---|---|
| Public | 1,181 | 76.4% |
| Private | 340 | 22.0% |
| Unknown | 24 | 1.6% |
| Total | 1,545 | 100.0% |
Public facilities therefore account for more than three-quarters of the mapped healthcare facilities included in the analysis.
At the more detailed ownership-type level, Local Government accounts for the largest recorded group with 872 facilities. Other recorded ownership types include For Profit, State Government, Not For Profit, Federal Government, Military & Paramilitary, and records with Unknown ownership type.
A1 Key Results
| A1 Indicator | Result |
|---|---|
| Mapped healthcare facilities | 1,545 |
| LGAs covered | 23 |
| Highest facility count | Chikun — 103 |
| Lowest facility count | Igabi — 17 |
| Primary Health Clinics + Primary Health Centers + Health Posts | 1,391 — 90.0% |
| Public ownership | 1,181 — 76.4% |
Interpretation Boundary
A1 describes the mapped healthcare facilities contained in the source dataset and their recorded attributes.
Facility counts do not measure facility capacity, staffing, service quality, operating status, utilization, treatment availability, or patient catchment.
Absolute facility counts also do not account for differences in LGA population. Population-relative availability is therefore examined separately in A2 — Population-Relative Facility Availability.
06 — A2: Population-Relative Facility Availability
Analytical Question
How does the availability of mapped healthcare facilities vary across Kaduna State when facility counts are considered relative to the population of each LGA?
Purpose
Absolute facility counts alone do not indicate whether the number of healthcare facilities is proportionate to the population potentially served. An LGA with a comparatively large number of facilities may also have a large population, while an LGA with fewer facilities may serve a much smaller population.
A2 therefore introduces population context to the facility distribution established in A1. Two complementary indicators are used: healthcare facilities per 100,000 population and population per healthcare facility.
Together, these indicators provide a population-relative view of mapped facility availability across the 23 LGAs.
Method
The mapped healthcare facility count for each LGA was combined with the corresponding LGA population value used in the project analysis.
Two indicators were calculated:
Healthcare Facilities per 100,000 Population
Facility availability was standardized using:
\text{Facilities per 100,000 population} = \frac{\text{Number of mapped healthcare facilities}}{\text{LGA population}} \times 100,000
Higher values indicate a greater number of mapped healthcare facilities relative to population.
Population per Healthcare Facility
A second indicator was calculated as:
\text{Population per facility} = \frac{\text{LGA population}}{\text{Number of mapped healthcare facilities}}
Lower values indicate fewer people per mapped healthcare facility, while higher values indicate a larger population associated with each facility.
The two measures describe the same facility–population relationship from different perspectives and are used together to support interpretation.
Population-Relative Facility Availability
The population-relative results show that the pattern of healthcare facility availability differs from the absolute facility-count pattern identified in A1.
LGAs with relatively high absolute facility counts do not necessarily retain the strongest position after population is incorporated. Conversely, some LGAs with moderate facility counts may have comparatively favourable population-relative availability because they serve smaller populations.
This distinction is important because facility count and population-relative availability represent different dimensions of healthcare infrastructure distribution.
Healthcare Facilities per 100,000 Population
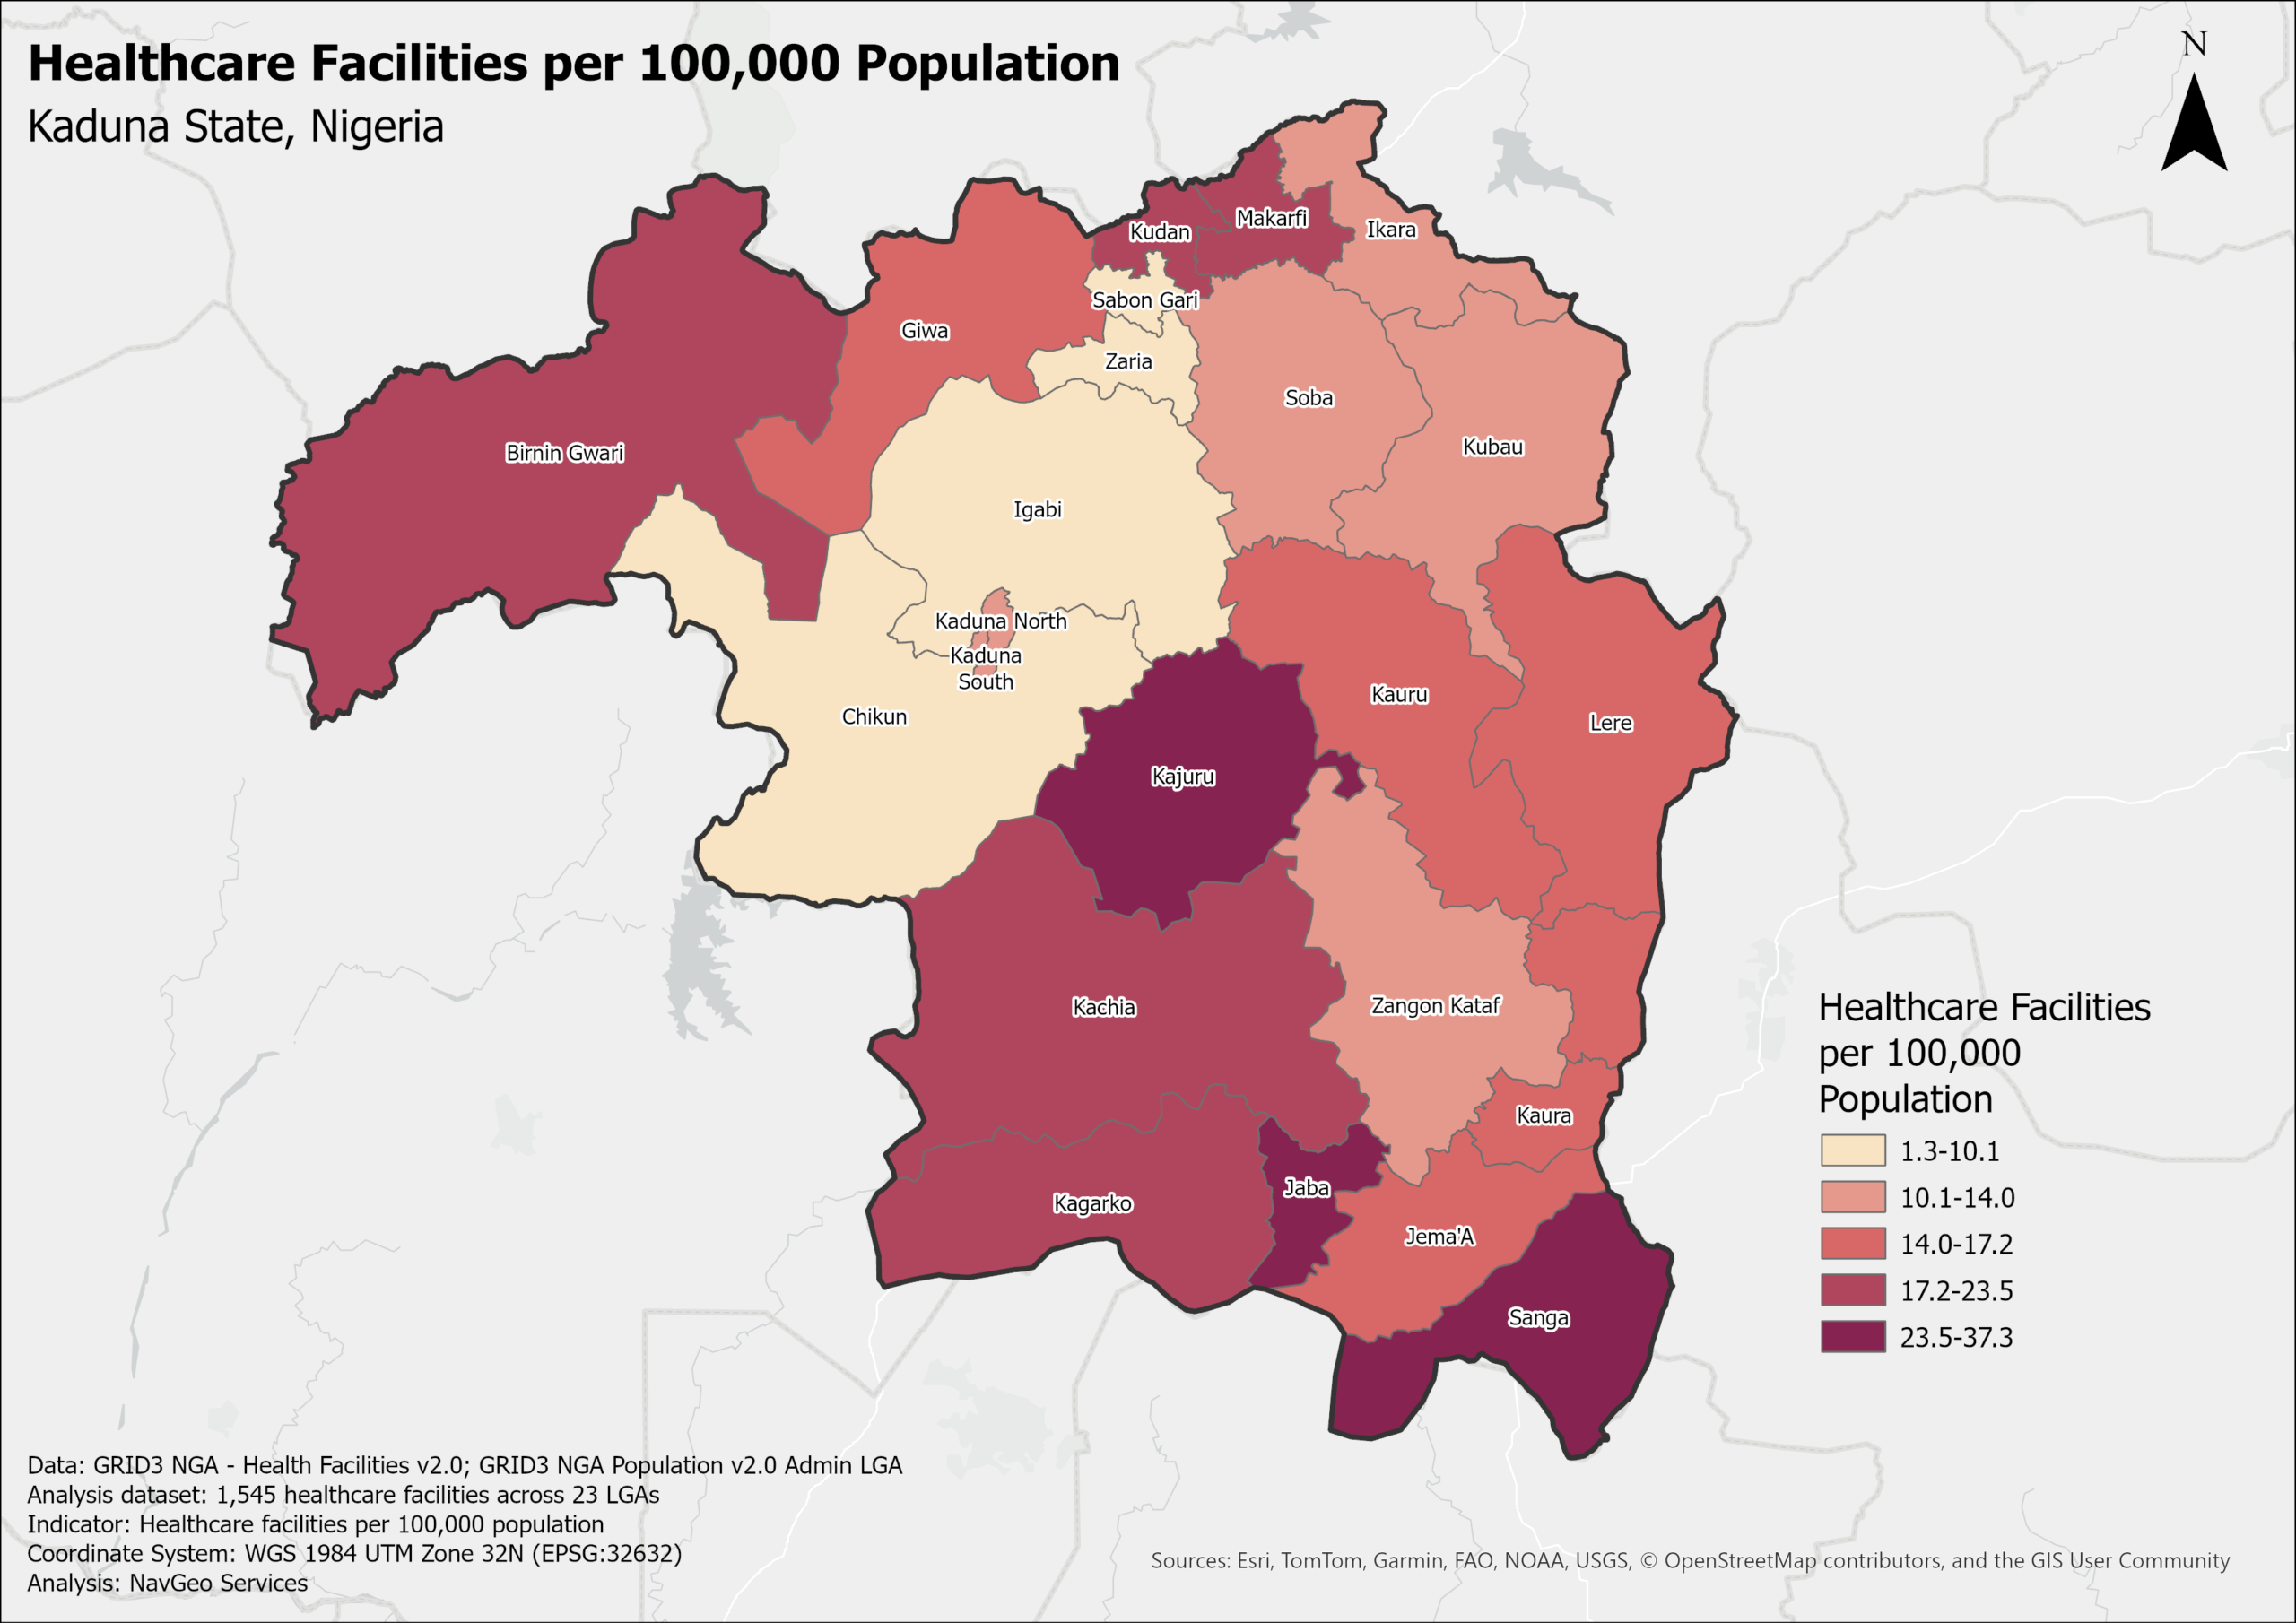
The population-normalized distribution shows substantial variation in mapped healthcare facility availability across Kaduna State. Across the 23 LGAs, the indicator ranges from approximately 1.26 to 37.34 healthcare facilities per 100,000 population.
This pattern differs from the absolute facility-count distribution presented in A1. LGAs with relatively large numbers of mapped facilities do not necessarily have high facility availability after population is taken into account.
Igabi provides the clearest example. Although 17 mapped healthcare facilities are recorded in the LGA, its population of approximately 1.35 million results in only about 1.26 facilities per 100,000 population, placing it at the low end of population-relative facility availability.
Population per Healthcare Facility
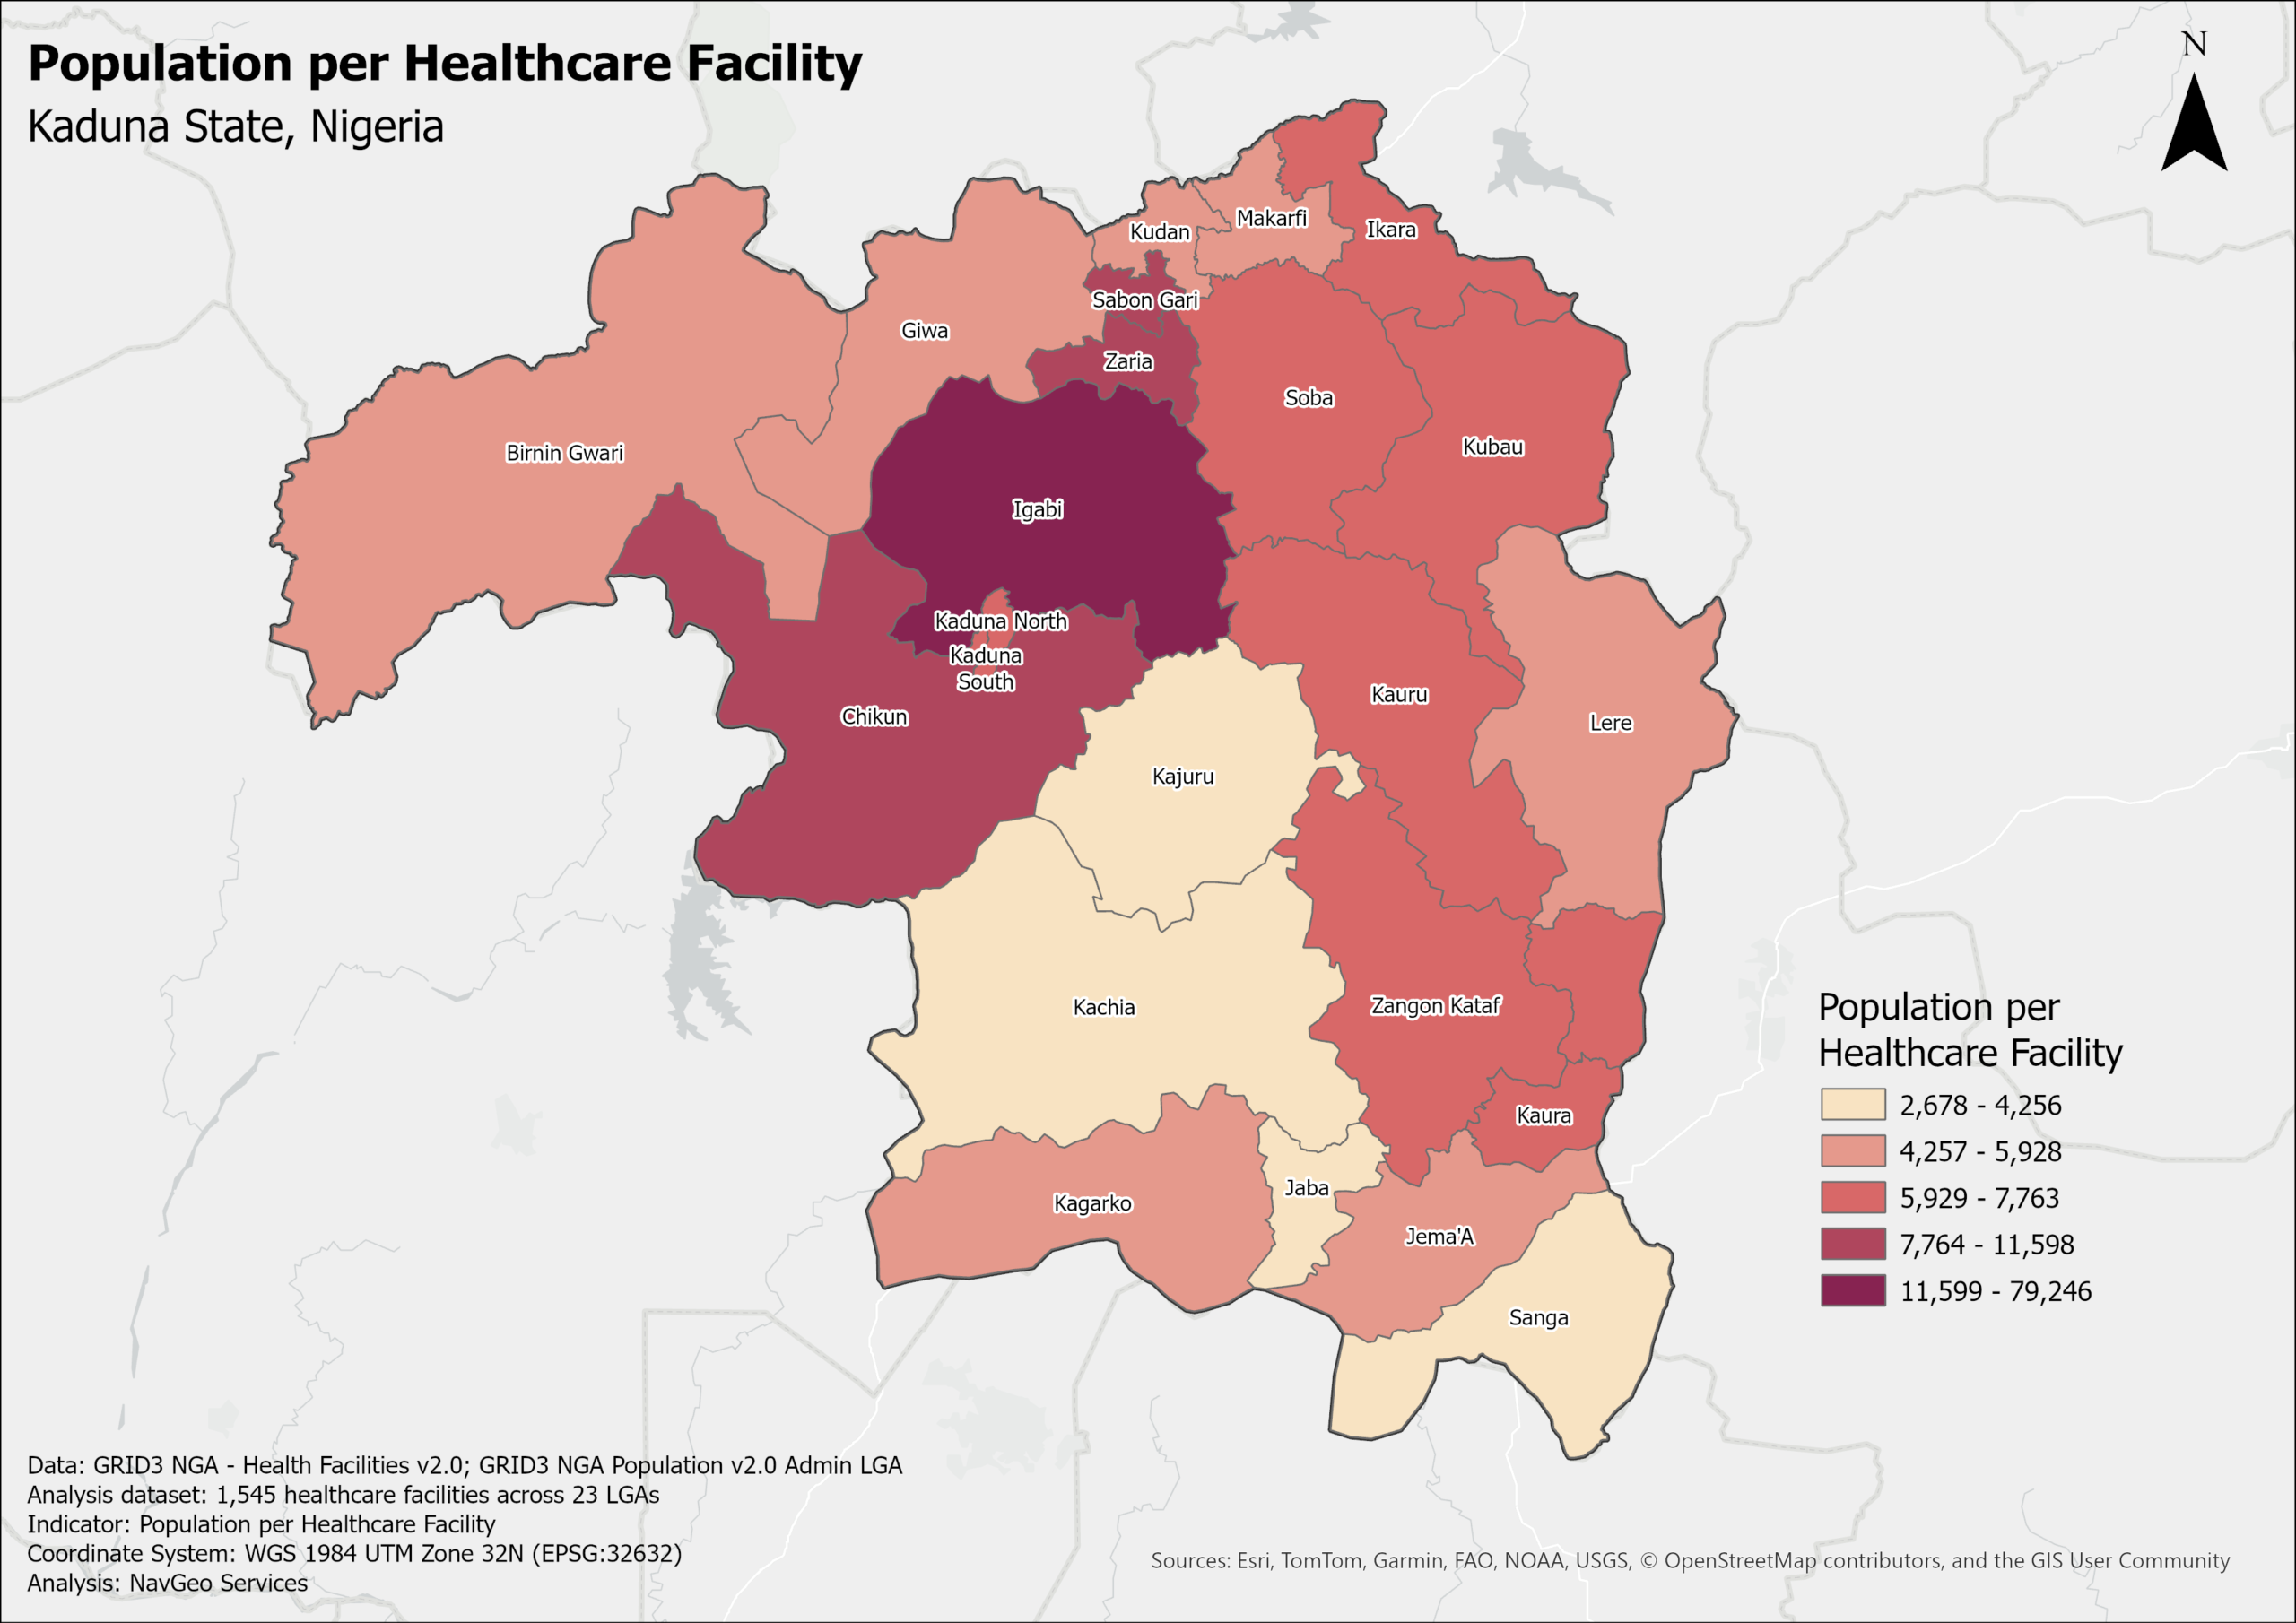
The second indicator expresses the same facility–population relationship from the opposite perspective. Across the 23 LGAs, the population represented by each mapped healthcare facility ranges from approximately 2,678 to 79,246 persons per facility.
Lower values indicate fewer people per mapped facility, while higher values indicate a substantially larger population relative to the number of mapped facilities.
Again, Igabi represents the upper end of the range, with approximately 79,246 people per mapped healthcare facility. The spatial pattern therefore reinforces the finding from the first indicator: absolute facility counts alone can conceal substantial differences in population-relative facility availability.
A2 Key Results
| A2 Indicator | Result |
|---|---|
| LGAs analyzed | 23 |
| Healthcare facilities analyzed | 1,545 |
| Healthcare facilities per 100,000 population | 1.26–37.34 |
| Population per healthcare facility | 2,678–79,246 |
| Lowest population-relative facility availability | Igabi |
| Igabi healthcare facilities | 17 |
| Igabi population | 1,347,174 |
| Igabi facilities per 100,000 population | ≈1.26 |
| Igabi population per healthcare facility | ≈79,246 |
Interpretation Boundary
A2 measures the relationship between the number of mapped healthcare facilities and the population values used in the analysis. It does not measure facility capacity, staffing, bed availability, service quality, operating status, utilization, or the actual number of people served by individual facilities.
The indicators should therefore be interpreted as measures of population-relative mapped facility availability, not as measures of healthcare service adequacy.
07 — A3: Healthcare Accessibility & LGA Priority
Analytical Question
How accessible are mapped healthcare facilities from populated settlements across Kaduna State, and which LGAs show the greatest concentration of settlements with poor healthcare accessibility?
Purpose
A1 established the spatial distribution and characteristics of mapped healthcare facilities, while A2 examined facility availability relative to LGA population. Neither analysis, however, measures how far individual settlements are located from healthcare facilities.
A3 therefore introduces a settlement-level accessibility measure. Each populated settlement was evaluated according to its distance to the nearest mapped healthcare facility, allowing accessibility conditions to be classified consistently across Kaduna State.
The settlement-level results were then summarized by LGA to identify geographic differences in healthcare accessibility and establish an LGA Access Priority classification.
Method
For each populated settlement, the distance to the nearest mapped healthcare facility was calculated using the projected analysis datasets.
Settlement accessibility was classified using five distance bands:
| Accessibility Class | Distance to Nearest Healthcare Facility |
|---|---|
| Very Good | ≤ 2 km |
| Good | > 2–5 km |
| Limited | > 5–10 km |
| Poor | > 10–20 km |
| Very Poor | > 20 km |
The classified settlement results were subsequently summarized by LGA. The proportion of settlements falling within the poorer accessibility classes was used to support the LGA-level accessibility assessment.
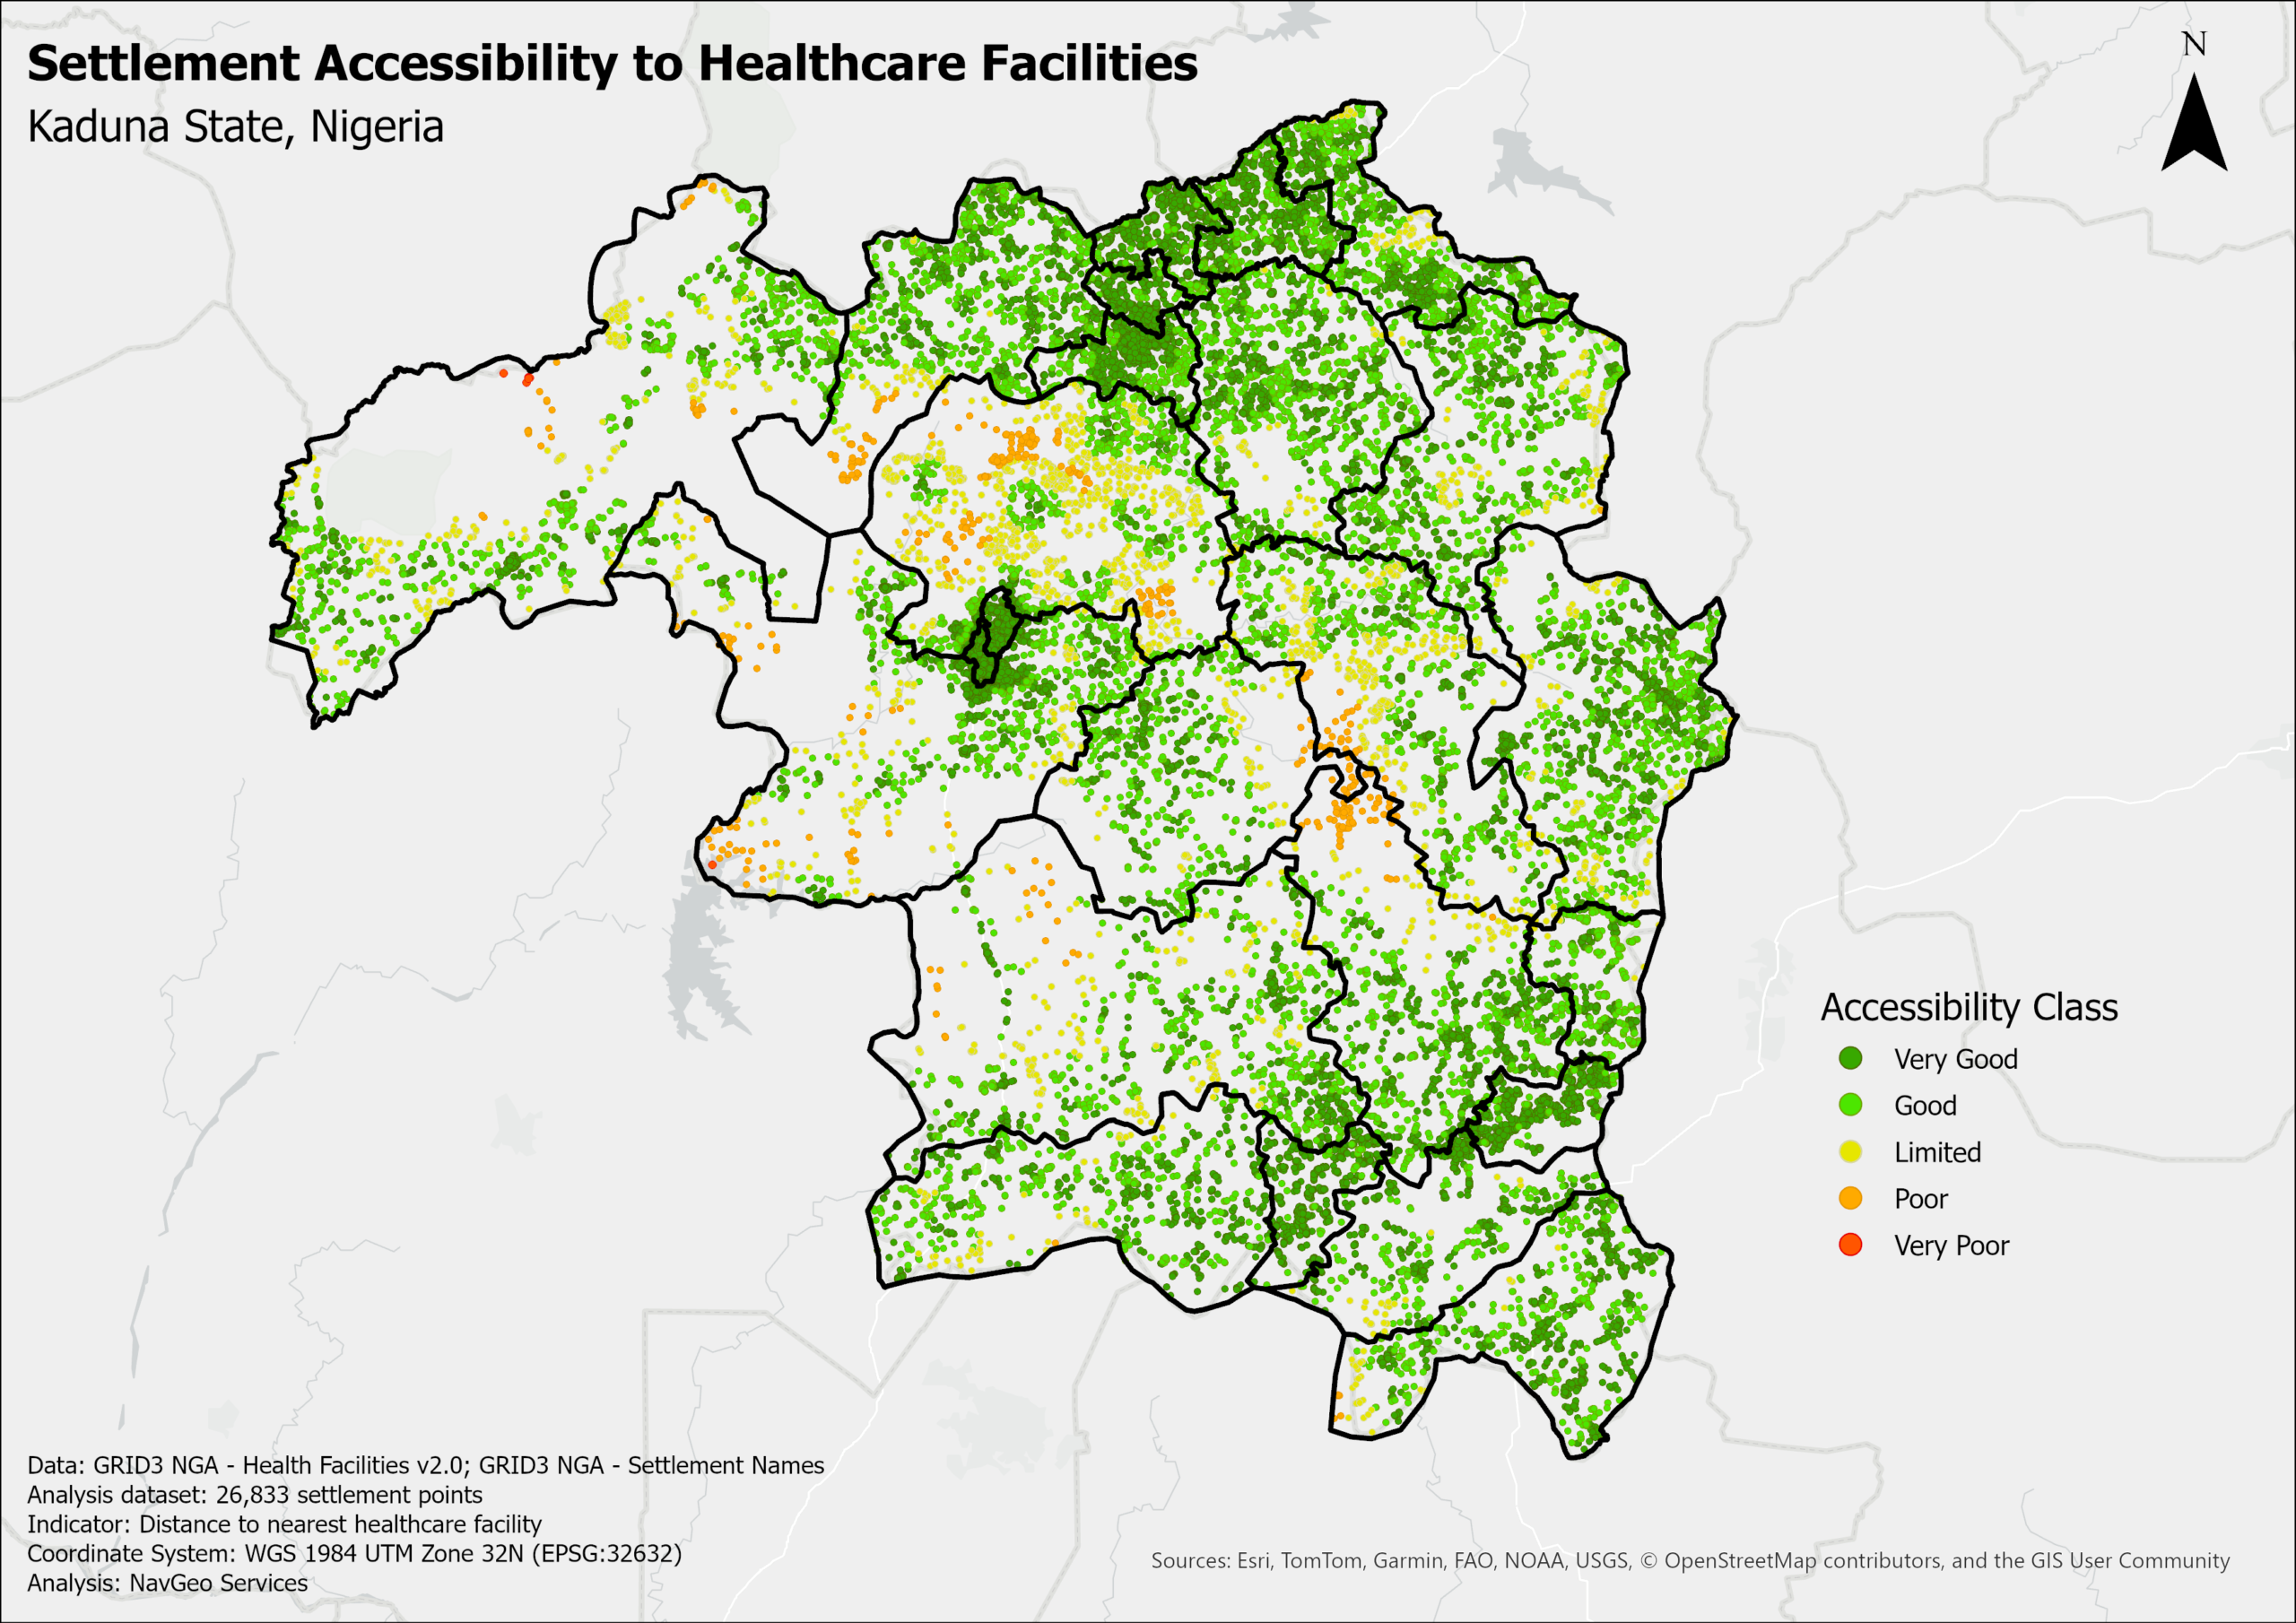
Settlement-Level Healthcare Accessibility
The analysis covered 26,833 populated settlements across all 23 LGAs of Kaduna State.
The results show that healthcare accessibility varies considerably across the settlement network. Some settlements are located relatively close to mapped healthcare facilities, while others are separated from the nearest facility by substantially greater distances.
The five accessibility classes provide a consistent way of distinguishing these conditions and identifying settlements where geographic access to mapped healthcare facilities is comparatively constrained.
Spatial Pattern of Settlement Accessibility
The settlement-level results show a strongly differentiated accessibility pattern across Kaduna State. Settlements located close to mapped healthcare facilities fall within the Very Good and Good accessibility classes, while progressively greater nearest-facility distances are represented by the Limited, Poor, and Very Poor classes.
The spatial distribution also shows that accessibility constraints are not uniform across the state. Poorer-access settlements occur in geographically distinct concentrations, demonstrating that healthcare accessibility cannot be adequately understood from facility counts alone.
This settlement-level pattern provides the analytical foundation for the next stage of A3, where accessibility disadvantage is aggregated and compared across the 23 LGAs.
LGA-Level Accessibility Assessment
Settlement-level accessibility results were aggregated to the LGA level to show how accessibility conditions vary geographically across Kaduna State.
This aggregation is important because an LGA may contain a mixture of well-served and poorly served settlements. Looking only at an LGA-wide average could conceal these internal differences.
The LGA assessment therefore considers the distribution of settlement accessibility classes and provides a geographic basis for identifying areas where poor healthcare accessibility is more concentrated.
Accessibility Disadvantage Across LGAs
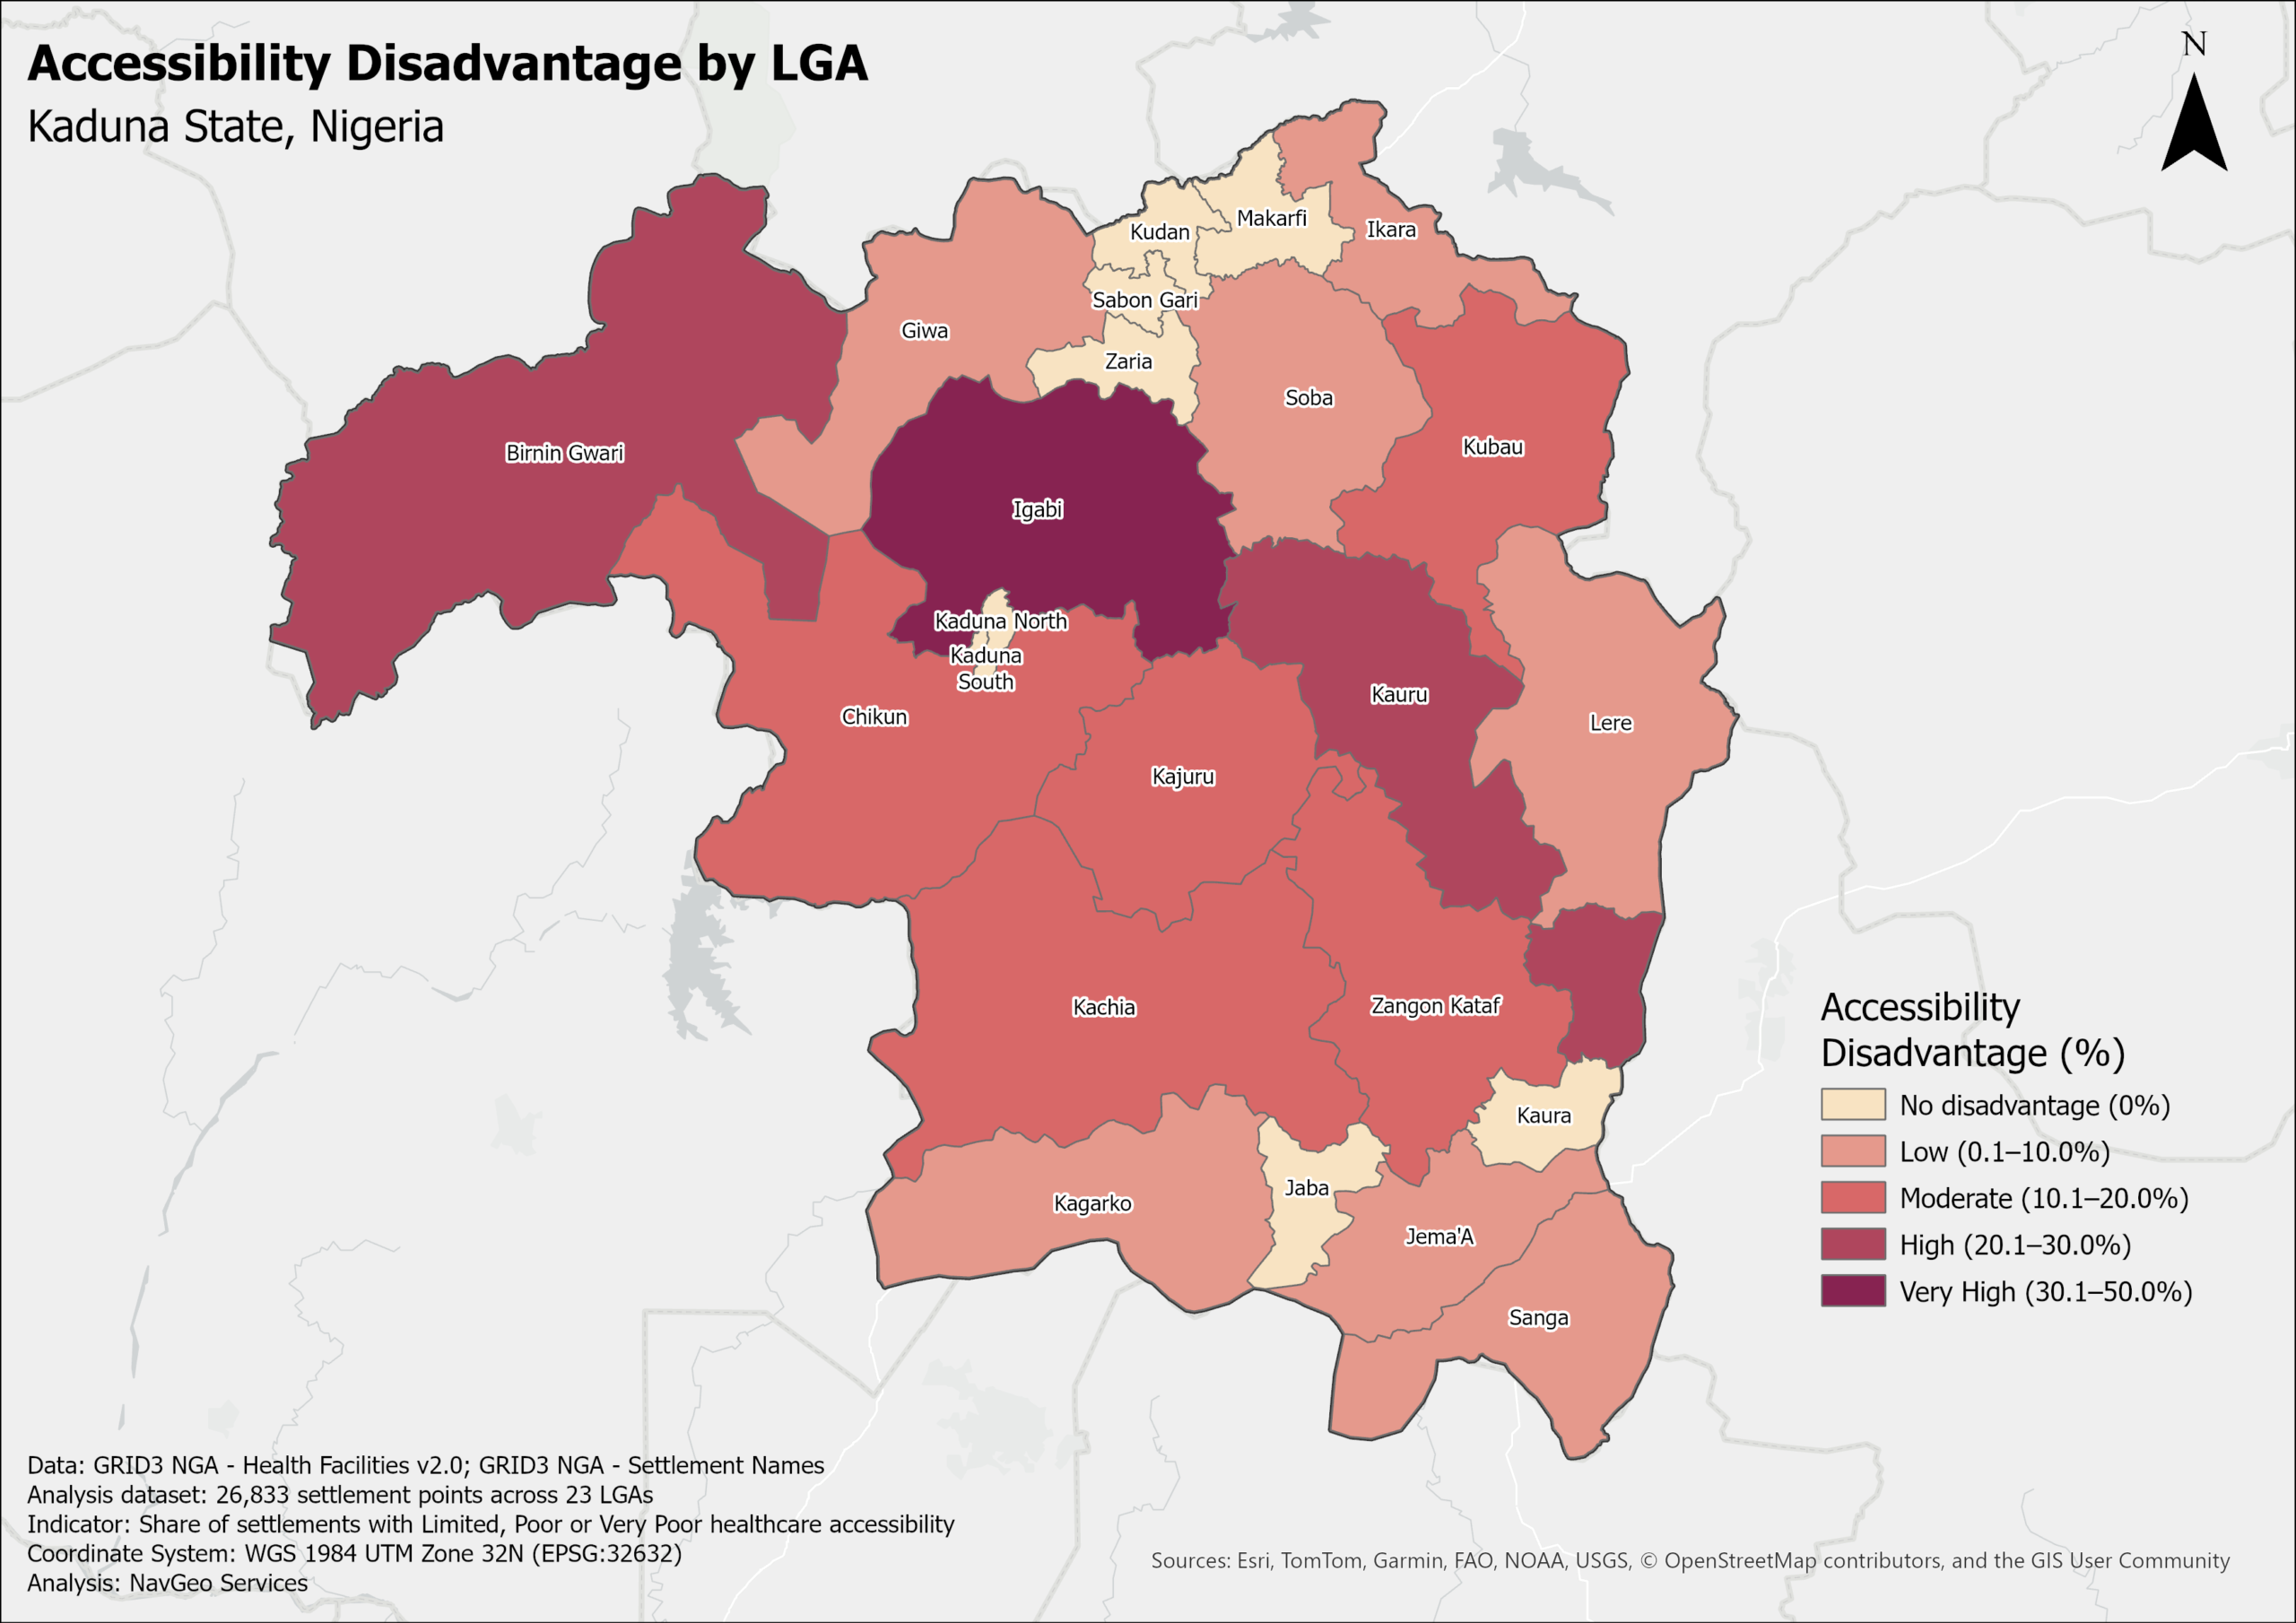
The LGA-level analysis summarizes settlement accessibility disadvantage using the proportion of settlements falling within the Limited, Poor, and Very Poor accessibility classes.
The results reveal substantial geographic variation across Kaduna State. Some LGAs contain relatively small proportions of disadvantaged settlements, while others show much stronger concentrations of settlements located farther from mapped healthcare facilities.
The finalized analysis identified Igabi as the most pronounced case of accessibility disadvantage. Approximately 49.0% of settlements in Igabi fall within the Limited, Poor, or Very Poor accessibility classes, including approximately 20.8% classified as Poor or Very Poor.
The LGA-level disadvantage assessment therefore provides an intermediate analytical step between the individual settlement classifications and the final Healthcare Access Priority assessment.
LGA Access Priority
Based on the settlement accessibility results, each LGA was assigned an Access Priority category:
Very High → High → Moderate → Low → Very Low
The priority classification provides an LGA-level summary of geographic healthcare accessibility. It does not replace the settlement-level results; instead, it identifies the broader administrative areas where accessibility constraints warrant greater attention.

Healthcare Access Priority Results
The final A3 assessment translates the settlement accessibility evidence into an LGA-level healthcare access priority classification. The 23 LGAs are distributed across five priority categories:
| Healthcare Access Priority | Number of LGAs |
|---|---|
| Very High | 1 |
| High | 4 |
| Moderate | 5 |
| Low | 9 |
| Very Low | 4 |
| Total | 23 |
Igabi is the only LGA classified as Very High priority, with an access-priority score of 10. Four additional LGAs fall within the High-priority category. Together, these results identify the parts of Kaduna State where settlement-level geographic accessibility constraints are most pronounced.
The priority classification should be interpreted as a spatial screening result. A higher priority indicates a comparatively stronger concentration of settlement accessibility disadvantage within the analytical framework; it does not by itself establish healthcare service deficiency or determine where new facilities should be constructed.
A3 Key Results
| A3 Indicator | Result |
|---|---|
| Settlement points analysed | 26,833 |
| LGAs analysed | 23 |
| Accessibility classes | 5 |
| LGA priority classes | 5 |
| Very High priority LGAs | 1 |
| High priority LGAs | 4 |
| Moderate priority LGAs | 5 |
| Low priority LGAs | 9 |
| Very Low priority LGAs | 4 |
| Highest-priority LGA | Igabi |
| Igabi Access Priority score | 10 |
| Igabi Limited + Poor + Very Poor settlements | ≈49.0% |
| Igabi Poor + Very Poor settlements | ≈20.8% |
Interpretation Boundary
A3 evaluates geographic accessibility to mapped healthcare facilities using nearest-facility distance and settlement-level spatial patterns. The resulting LGA priority classification is intended to identify relative geographic accessibility disadvantage within the study area.
The analysis does not evaluate healthcare facility capacity, staffing, service availability, operating condition, quality of care, patient demand, travel time, road condition, transport availability, or actual healthcare utilization. Distance-based accessibility should therefore be interpreted as a spatial screening indicator, not as a complete assessment of healthcare access or service adequacy.
08 — A4: Underserved Settlement Identification
Analytical Question
Which populated settlements in Kaduna State experience comparatively constrained geographic access to mapped healthcare facilities, and how are these underserved settlements distributed across the 23 LGAs?
Purpose
A3 classified settlement accessibility according to distance from the nearest mapped healthcare facility and used those results to establish an LGA-level healthcare access priority assessment.
A4 takes the analysis one step further by isolating the settlements experiencing the greater accessibility constraints. Settlements classified in A3 as Limited, Poor, or Very Poor are treated as underserved for the purposes of this spatial screening analysis.
This creates a defined underserved-settlement subset that can be examined independently from settlements with Very Good or Good accessibility and subsequently used in the healthcare intervention priority analysis in A5.
Method
The settlement-level accessibility classifications produced in A3 were used directly as the analytical input for A4.
Settlements belonging to the following three accessibility classes were selected:
| Underserved Accessibility Class | Distance to Nearest Healthcare Facility |
|---|---|
| Limited | > 5–10 km |
| Poor | > 10–20 km |
| Very Poor | > 20 km |
Settlements classified as Very Good (≤2 km) or Good (>2–5 km) were therefore excluded from the underserved-settlement subset.
The selected settlements were retained with their LGA association and accessibility classification so that their distribution could be summarized geographically and used in the subsequent A5 analysis.
Underserved Settlement Distribution
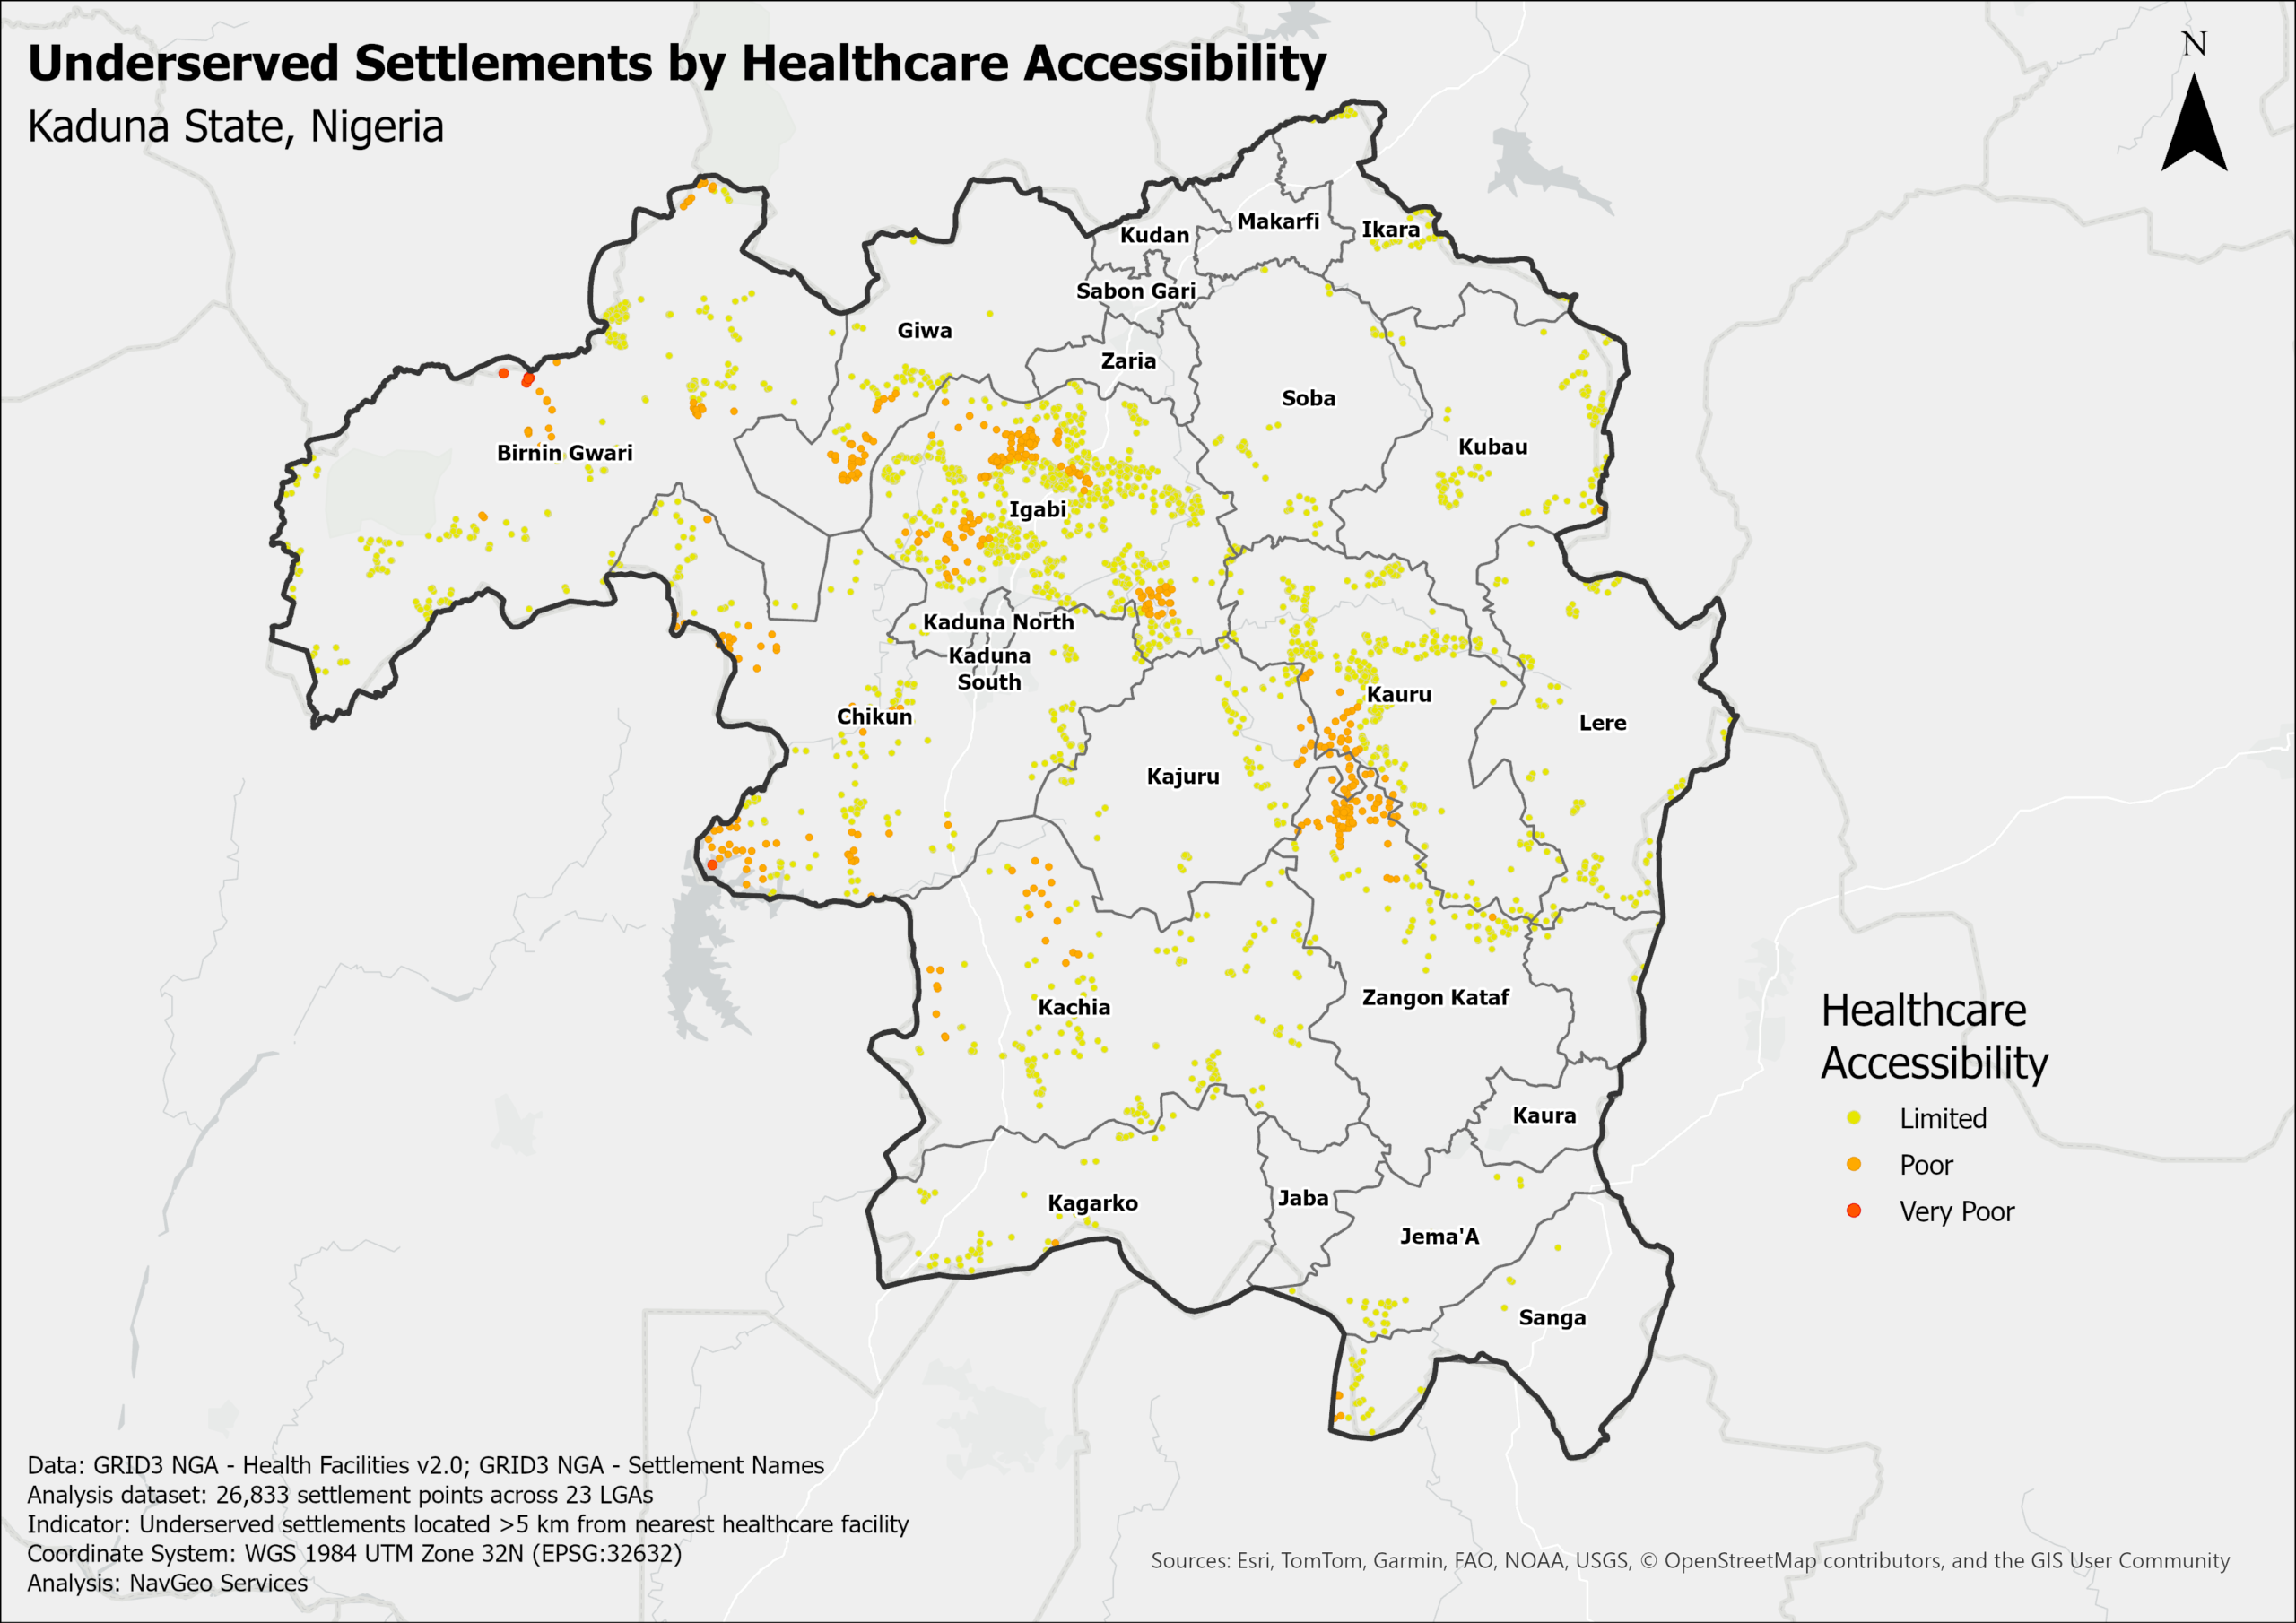
The resulting underserved-settlement dataset identifies the locations where settlement-to-facility distance exceeds 5 km within the analytical framework.
The underserved settlements are not distributed uniformly across Kaduna State. Their spatial pattern reflects substantial geographic variation in proximity to mapped healthcare facilities, with some LGAs containing comparatively greater concentrations of Limited, Poor, and Very Poor accessibility conditions.
The three underserved classes also represent different degrees of geographic constraint. Limited settlements are located more than 5 km and up to 10 km from the nearest mapped healthcare facility, while Poor and Very Poor settlements represent progressively greater nearest-facility distances.
Relationship to A5
A4 is an identification and screening stage.
All settlements identified as underserved in A4 provide the analytical population for A5 — Healthcare Intervention Priority, where additional criteria are applied to distinguish Critical, Elevated, and Watch priority settlements.
This separation is important: being classified as underserved in A4 does not automatically mean that a settlement is classified as Critical in A5.
Underserved Settlement Results
A4 identified 2,857 of the 26,833 analyzed settlement points as underserved because they are located more than 5 km from the nearest mapped healthcare facility. This represents 10.65% of the complete settlement analysis dataset.
The underserved subset consists of:
| Accessibility Class | Settlements |
|---|---|
| Limited | 2,418 |
| Poor | 432 |
| Very Poor | 7 |
| Total Underserved | 2,857 |
The Poor and Very Poor classes together contain 439 settlements, equal to 1.64% of all 26,833 analysed settlements. These settlements form the severely underserved subset because their straight-line distance to the nearest mapped healthcare facility exceeds 10 km.
Geographic Concentration of Severe Underservice
Severe underservice is concentrated in a relatively small number of LGAs. Igabi contains 157 severe settlements, Chikun 62, Zangon Kataf 59, and Birnin Gwari 48. Together, these four LGAs contain 326 of the 439 severe settlements, equal to 74.3%.
The most extreme accessibility class is uncommon but highly localized. Only 7 settlements fall within the Very Poor class, defined as more than 20 km from the nearest mapped healthcare facility. Six are located in Birnin Gwari and one in Chikun.
Spatial Pattern of Underserved Settlements
The map shows that underserved settlements occur across multiple parts of Kaduna State, with Limited settlements forming the largest component of the spatial pattern. Poor and Very Poor settlements are considerably fewer and appear as more localized concentrations.
The map therefore provides the principal spatial view of the A4 underserved-settlement subset and shows both the location and accessibility severity of settlements carried forward into the A5 intervention-priority analysis.
A4 Key Results
| A4 Indicator | Result |
|---|---|
| Settlement points analysed | 26,833 |
| Underserved settlements (>5 km) | 2,857 |
| Share of all settlements underserved | 10.65% |
| Limited settlements | 2,418 |
| Poor settlements | 432 |
| Very Poor settlements | 7 |
| Severely underserved (>10 km) | 439 |
| Share severely underserved | 1.64% |
| Severe cases in Igabi + Chikun + Zangon Kataf + Birnin Gwari | 326 / 439 — 74.3% |
| Very Poor settlements in Birnin Gwari | 6 |
| Very Poor settlements in Chikun | 1 |
Interpretation Boundary
A4 identifies settlement points exceeding the project’s 5 km straight-line accessibility threshold. The underserved percentage refers to settlement points, not the share of Kaduna State’s population.
The 5 km, 10 km, and 20 km thresholds are analytical classification bands used consistently within this showcase. They are not presented as universal healthcare planning standards.
The analysis does not measure network travel time, transport availability, road condition, facility capacity, service availability, patient demand, or actual healthcare utilization.
09 — A5: Healthcare Intervention Priority
Analytical Question
Which of the underserved settlements identified in A4 warrant comparatively greater attention when healthcare accessibility disadvantage is considered together with settlement and LGA context?
Purpose
A4 identified 2,857 underserved settlements located more than 5 km from the nearest mapped healthcare facility. However, the underserved settlements do not all experience the same degree or context of geographic disadvantage.
A5 therefore introduces a healthcare intervention priority classification. The purpose is to differentiate the underserved-settlement population into progressively stronger priority groups and identify a smaller subset where the combined analytical conditions indicate comparatively greater potential concern.
The resulting classification provides a transparent spatial screening mechanism for distinguishing Critical, Elevated, and Watch settlements.
Analytical Population
A5 uses the 2,857 underserved settlements identified in A4 as its analytical population.
Settlements classified as Very Good or Good in A3 are not included because A5 is specifically designed to prioritize settlements already identified as underserved.
The intervention-priority assessment therefore represents a refinement of the A4 results rather than a new analysis of all 26,833 settlement points.
Priority Classification
Each underserved settlement was evaluated using the A5 intervention-priority framework and assigned to one of three categories:
| Intervention Priority | Interpretation |
|---|---|
| Critical | Strongest combined indication of geographic healthcare accessibility disadvantage within the A5 framework |
| Elevated | Meaningful accessibility disadvantage requiring comparatively greater attention than the Watch group |
| Watch | Underserved settlements retained for monitoring and contextual consideration but with a lower combined priority within the framework |
Role of Critical Settlements
The Critical category has a particularly important role in the overall analytical framework.
A5 reduces the broader underserved-settlement population to a more focused subset of settlements exhibiting the strongest combined priority conditions. These Critical settlements are then carried forward into A6–A10 for more detailed contextual analysis.
The subsequent analyses examine their relationship with road remoteness, nearest healthcare facility characteristics, population context, nearest-facility concentration, and road type.
In this way, A5 acts as the bridge between the broad accessibility screening conducted in A3–A4 and the detailed contextual assessment undertaken in A6–A10.
Intervention Priority Rules
A5 combines two validated inputs:
- the settlement accessibility class from A4; and
- the LGA Healthcare Access Priority from A3.
A rule-based classification was used so that each intervention category can be traced directly to these two inputs.
| Intervention Priority | Rule |
|---|---|
| Critical | Poor or Very Poor settlement and LGA Priority is High or Very High |
| Elevated | Limited settlement in High/Very High LGA or Poor/Very Poor settlement in Moderate/Low/Very Low LGA |
| Watch | Limited settlement in Moderate, Low, or Very Low LGA |
This classification applies explicit combinations of the already-established A3 and A4 classes.
Intervention Priority Results
The 2,857 underserved settlements were classified into:
| Intervention Priority | Settlements | Share |
|---|---|---|
| Critical | 307 | 10.7% |
| Elevated | 1,655 | 57.9% |
| Watch | 895 | 31.3% |
| Total | 2,857 | 100.0% |
The Critical category therefore contains 307 settlements and forms the analytical subset carried forward to A6–A10.
Geographic Concentration of Critical Settlements
The 307 Critical settlements occur in only five LGAs:
| LGA | Critical Settlements |
|---|---|
| Igabi | 157 |
| Chikun | 62 |
| Zangon Kataf | 59 |
| Kauru | 28 |
| Kubau | 1 |
| Total | 307 |
Igabi contains 157 of the 307 Critical settlements, equal to 51.1% of the statewide Critical total.
The geographic concentration becomes even more pronounced when the three largest Critical-settlement LGAs are considered together. Igabi, Chikun, and Zangon Kataf contain 278 of the 307 Critical settlements, equal to 90.6%.

Spatial Pattern of Intervention Priority
The map shows a clear geographic concentration of Critical settlements within a small number of LGAs, while Elevated and Watch settlements are distributed more widely across the underserved-settlement population.
The spatial pattern is strongest in Igabi, Chikun, and Zangon Kataf, which together contain more than nine-tenths of all Critical settlements. The map therefore provides the principal geographic representation of the A5 priority classification and establishes the 307 Critical settlements examined in A6–A10.
A5 Key Results
| A5 Indicator | Result |
|---|---|
| Underserved settlements assessed | 2,857 |
| Critical | 307 — 10.7% |
| Elevated | 1,655 — 57.9% |
| Watch | 895 — 31.3% |
| LGAs containing Critical settlements | 5 |
| Igabi Critical settlements | 157 — 51.1% |
| Chikun Critical settlements | 62 |
| Zangon Kataf Critical settlements | 59 |
| Kauru Critical settlements | 28 |
| Kubau Critical settlements | 1 |
| Igabi + Chikun + Zangon Kataf | 278 / 307 — 90.6% |
Interpretation Boundary
A5 is a comparative spatial screening framework derived from settlement accessibility severity and LGA Healthcare Access Priority.
The Critical, Elevated, and Watch classifications are study-derived analytical categories. They are not official government priority designations, funding categories, or instructions for facility construction.
The A5 result identifies locations for further planning assessment. It does not account for facility capacity, staffing, service availability, patient demand, road condition, travel time, implementation feasibility, land availability, or healthcare policy priorities.
10 — A6: Critical Settlement Road Remoteness
Analytical Question
How far are the 307 Critical settlements identified in A5 from the nearest mapped road, and to what extent is road remoteness present within the Critical-settlement group?
Purpose
The A5 analysis identified 307 Critical settlements based on settlement healthcare accessibility and LGA healthcare access priority. These settlements are concentrated in five LGAs and represent the highest intervention-priority group defined in the study.
A6 examines the location of these settlements in relation to the mapped road network. The analysis measures the straight-line distance from each Critical settlement to its nearest mapped road. This allows road proximity to be examined separately from the healthcare-facility distance used in the accessibility analysis.
The analysis determines how many Critical settlements are located close to the mapped road network and identifies the smaller group where nearest-road distances are comparatively greater.
Input Data
The analysis uses the 307 Critical settlements identified in A5 together with the prepared Kaduna road network dataset.
Each Critical settlement retains the healthcare-accessibility and intervention-priority information produced in the preceding analyses. The road dataset supplies the line features used to identify the nearest mapped road and calculate the corresponding straight-line distance.
The analysis is restricted to the Critical-settlement group. Elevated and Watch settlements are not included in the A6 calculations.
Method
For each of the 307 Critical settlements, the nearest mapped road was identified and the straight-line distance between the settlement point and that road was calculated in metres.
The resulting road-distance value was stored in the ROAD_DIST field. The complete set of 307 ROAD_DIST values was then examined statistically to describe road proximity within the Critical-settlement group.
The analysis considered the median, mean and third-quartile road distances together with the number of settlements exceeding 500 m and 1 km from the nearest mapped road. The 500 m and 1 km values were used as descriptive screening thresholds for the road-distance distribution; they were not adopted as healthcare or transport planning standards.
Road Proximity of Critical Settlements
Most Critical settlements are located close to a mapped road in straight-line distance.
The median ROAD_DIST is 13.18 m, while the third quartile is 51.21 m. At least three-quarters of the 307 Critical settlements are therefore within approximately 51 m of their nearest mapped road.
The mean road distance is 68.11 m, which is higher than the median. A small number of settlements with much larger road-distance values raise the mean above the centre of the overall distribution.
Critical Settlements Within 500 m of a Mapped Road
Of the 307 Critical settlements, 297 are located within 500 m of the nearest mapped road. This represents 96.7% of the Critical-settlement group.
Only 10 settlements, or 3.3%, are more than 500 m from their nearest mapped road. The results show that poor healthcare accessibility among the Critical settlements is generally not accompanied by large straight-line distances from the mapped road network.
Critical Settlements Beyond 500 m
The 10 Critical settlements exceeding 500 m are concentrated in two LGAs.
Nine are located in Igabi and one in Chikun. Of these 10 settlements, five are more than 1 km from the nearest mapped road.
These records form the comparatively road-remote part of the Critical-settlement group and account for the upper end of the ROAD_DIST distribution.
Road Remoteness by LGA
| lganame | FREQUENCY | COUNT_ROAD |
| Chikun | 1 | 1 |
| Igabi | 9 | 9 |
A6 Key Results
| A6 Indicator | Result |
|---|---|
| Critical settlements analysed | 307 |
| Median distance to nearest mapped road | 13.18 m |
| Mean distance to nearest mapped road | 68.11 m |
| Third quartile | 51.21 m |
| Settlements within 500 m | 297 — 96.7% |
| Settlements beyond 500 m | 10 — 3.3% |
| Settlements beyond 1 km | 5 — 1.6% |
| >500 m settlements in Igabi | 9 |
| >500 m settlements in Chikun | 1 |
Interpretation Boundary
ROAD_DIST measures straight-line geometric distance from a settlement point to the nearest mapped road. It does not measure distance travelled along the road network.
The road dataset does not describe road surface condition, road quality, connectivity, passability, seasonal access, travel speed, public transport availability or travel time. A short straight-line distance to a mapped road should therefore not be interpreted as evidence of good transport access.
The 500 m and 1 km thresholds are descriptive screening values used in A6. They are not transport, healthcare-accessibility or infrastructure planning standards.
11 — A7: Nearest Healthcare Facility Characteristics
Analytical Question
What are the characteristics of the nearest mapped healthcare facilities associated with the 307 Critical settlements, and how does settlement-to-facility distance vary by facility type?
Purpose
A5 identified 307 Critical settlements with the highest intervention priority in the study. A7 examines the healthcare facilities nearest to these settlements.
The analysis considers two facility attributes: facility level and facility type. It also compares nearest-facility distance across the recorded facility types. These results describe the healthcare facility context associated with the Critical settlements.
The analysis is based on the nearest mapped healthcare facility for each Critical settlement. The results therefore describe 307 settlement-to-nearest-facility relationships and should not be interpreted as 307 unique healthcare facilities.
Input Data
A7 uses the 307 Critical settlements identified in A5 together with the prepared healthcare facility dataset.
For each Critical settlement, the nearest mapped healthcare facility identified during the accessibility analysis was linked to its recorded facility attributes. The relevant facility-level and facility-type information was then summarized across all 307 settlement records.
Nearest-facility distance was retained for each record and used to compare distance patterns among facility types.
Method
The nearest healthcare facility associated with each Critical settlement was examined using the facility attributes retained from the source dataset.
Three summaries were prepared:
- nearest healthcare facility level;
- nearest healthcare facility type; and
- nearest-facility distance by facility type.
For the distance analysis, the number of Critical settlements associated with each facility type was calculated together with the mean nearest-facility distance. Minimum and maximum distances were also retained in the detailed distance summary.
Nearest Healthcare Facility Level
All 307 Critical settlements have a Primary-level healthcare facility as their nearest mapped healthcare facility.
Table A7-01 — Nearest Healthcare Facility Level
| Facility Level | Critical Settlements |
|---|---|
| Primary | 307 |
| Total | 307 |
No Secondary- or Tertiary-level facility appears as the nearest mapped healthcare facility for any of the 307 Critical settlements.
This result describes the nearest-facility relationship only. It does not mean that Secondary or Tertiary facilities are absent from Kaduna State; A1 already showed that these facility levels are present in the wider healthcare facility dataset.
Nearest Healthcare Facility Type
The Primary-level facilities associated with the Critical settlements comprise several recorded facility types.
Table A7-02 — Nearest Healthcare Facility Type
| Facility Type | Critical Settlements | Share |
|---|---|---|
| Primary Health Center | 129 | 42.0% |
| Primary Health Clinic | 115 | 37.5% |
| Health Post | 34 | 11.1% |
| Unknown | 29 | 9.4% |
| Total | 307 | 100.0% |
Primary Health Centers form the largest group, accounting for 129 of the 307 nearest-facility relationships. Primary Health Clinics account for another 115. Together, these two facility types represent 244 records, or 79.5% of the Critical-settlement group.
Health Posts account for 34 records, while the facility type is recorded as Unknown for 29 settlements.
Mean Distance by Nearest Facility Type
Nearest-facility distance also varies among the four recorded facility-type groups.
Table A7-03 — Mean Distance by Facility Type
| Nearest Facility Type | Critical Settlements | Mean Distance |
|---|---|---|
| Primary Health Center | 129 | 11.38 km |
| Health Post | 34 | 12.29 km |
| Unknown | 29 | 13.04 km |
| Primary Health Clinic | 115 | 13.79 km |
The lowest mean nearest-facility distance is recorded for settlements associated with Primary Health Centers, at approximately 11.38 km. The highest mean is recorded for settlements associated with Primary Health Clinics, at approximately 13.79 km.
Health Posts have a mean distance of approximately 12.29 km, while records with Unknown facility type average approximately 13.04 km.
Distance Range by Nearest Facility Type
The detailed distance summary retains the minimum and maximum nearest-facility distances in addition to the mean.
Table A7-04 — Distance Statistics by Facility Type
| Facility Type | Critical Settlements | Mean | Minimum | Maximum |
|---|---|---|---|---|
| Health Post | 34 | 12.29 km | 10.32 km | 18.44 km |
| Primary Health Center | 129 | 11.38 km | 10.01 km | 16.30 km |
| Primary Health Clinic | 115 | 13.79 km | 10.02 km | 21.17 km |
| Unknown | 29 | 13.04 km | 10.05 km | 18.15 km |
The widest distance range occurs among settlements whose nearest facility is a Primary Health Clinic, extending from approximately 10.02 km to 21.17 km. The 21.17 km maximum is also the largest nearest-facility distance recorded among the four facility-type groups.
Primary Health Centers have the lowest mean distance and a narrower observed range of approximately 10.01–16.30 km.
A7 Key Results
| A7 Indicator | Result |
|---|---|
| Critical settlements analysed | 307 |
| Nearest facility level | Primary — 307 / 307 |
| Primary Health Center | 129 — 42.0% |
| Primary Health Clinic | 115 — 37.5% |
| Health Post | 34 — 11.1% |
| Unknown facility type | 29 — 9.4% |
| PHC + Primary Health Clinic | 244 — 79.5% |
| Lowest mean distance | Primary Health Center — 11.38 km |
| Highest mean distance | Primary Health Clinic — 13.79 km |
| Largest recorded distance | Primary Health Clinic — 21.17 km |
Interpretation Boundary
A7 describes the recorded attributes of the nearest mapped healthcare facility associated with each Critical settlement. Facility level and facility type are taken from the healthcare facility source dataset and retain the source classifications used in the project.
The analysis does not establish whether a facility was operational at the time of the study, what services were available, its staffing or capacity, opening hours, equipment, patient load, or quality of care.
Nearest-facility distance is a straight-line spatial distance. It does not represent road-network distance, travel time or actual patient travel behaviour.
12 — A8: Population Context of Critical Settlements
Analytical Question
How are the 307 Critical settlements distributed in relation to the population of the five LGAs in which they occur?
Purpose
A5 showed that the 307 Critical settlements are concentrated in Chikun, Igabi, Kauru, Kubau, and Zangon Kataf. The absolute number of Critical settlements varies considerably among these five LGAs.
A8 adds population context to these counts. The number of Critical settlements in each LGA is compared with its population, and a standardized rate of Critical settlements per 100,000 population is calculated.
This allows the five LGAs to be compared on both absolute Critical-settlement count and population-relative concentration.
Input Data
A8 uses the 307 Critical settlements identified in A5 and the population values for the five LGAs containing those settlements.
The population values are taken from the same prepared population dataset used earlier in the project. Each LGA therefore retains a consistent population value across the population-based analyses.
Only the five LGAs containing Critical settlements are included in the A8 table.
Method
Critical settlements were counted by LGA and linked to the corresponding LGA population.
The population-relative indicator was calculated as:
Critical settlements per 100,000 population = (Number of Critical settlements ÷ LGA population) × 100,000
The standardized rate allows comparison between LGAs with different population sizes. A higher value indicates a greater number of Critical settlements relative to the LGA population.
Critical Settlements by LGA and Population
The five LGAs show substantial differences in both their absolute Critical-settlement counts and their population-relative rates.
Table A8-01 — Critical Settlements by LGA
| LGA | Critical Settlements | Population | Critical Settlements per 100,000 Population |
|---|---|---|---|
| Chikun | 62 | 1,194,547 | 5.19 |
| Igabi | 157 | 1,347,174 | 11.65 |
| Kauru | 28 | 338,979 | 8.26 |
| Kubau | 1 | 533,683 | 0.19 |
| Zangon Kataf | 59 | 512,352 | 11.52 |
| Total Critical Settlements | 307 | — | — |
Absolute Critical-Settlement Counts
Igabi has the largest number of Critical settlements, with 157, followed by Chikun with 62 and Zangon Kataf with 59. Kauru contains 28 Critical settlements, while Kubau contains only one.
Igabi alone accounts for 51.1% of all 307 Critical settlements. Igabi, Chikun, and Zangon Kataf together contain 278 settlements, or 90.6% of the statewide Critical total.
The absolute counts show where Critical settlements are concentrated, but they do not account for differences in LGA population.
Critical Settlements per 100,000 Population
Population normalization changes the comparison among the five LGAs.
Igabi records the highest rate at approximately 11.65 Critical settlements per 100,000 population. Zangon Kataf follows very closely at approximately 11.52 per 100,000.
Kauru records approximately 8.26 Critical settlements per 100,000 population, while Chikun records approximately 5.19.
Kubau is substantially lower than the other four LGAs, with approximately 0.19 Critical settlements per 100,000 population. Its inclusion in the Critical-settlement group results from the single Critical settlement identified there.
Absolute Count and Population Context
Igabi ranks highest on both measures. It has the largest absolute number of Critical settlements and the highest population-relative rate among the five LGAs.
Zangon Kataf presents a different pattern. Its absolute count of 59 is lower than Chikun’s 62, but its population-relative rate is approximately 11.52 per 100,000, compared with 5.19 per 100,000 in Chikun.
Kauru also has fewer Critical settlements in absolute terms but records a higher population-relative rate than Chikun. These differences show the effect of LGA population size when the Critical-settlement counts are standardized.
A8 Key Results
| A8 Indicator | Result |
|---|---|
| Critical settlements analysed | 307 |
| LGAs containing Critical settlements | 5 |
| Highest absolute count | Igabi — 157 |
| Highest population-relative rate | Igabi — 11.65 per 100,000 |
| Zangon Kataf | 59 — 11.52 per 100,000 |
| Kauru | 28 — 8.26 per 100,000 |
| Chikun | 62 — 5.19 per 100,000 |
| Kubau | 1 — 0.19 per 100,000 |
| Igabi share of all Critical settlements | 51.1% |
| Igabi + Chikun + Zangon Kataf | 278 / 307 — 90.6% |
Interpretation Boundary
The population-relative rate compares the number of Critical settlement points with the total population of each LGA. It does not measure the number or proportion of people living within the Critical settlements themselves.
The population values are LGA-level estimates used in the project analysis. Settlement-level population was not assigned to individual Critical settlements in A8.
The indicator should therefore be read as Critical settlements per 100,000 LGA population, not as a measure of population directly affected by poor healthcare accessibility.
13 — A9: Nearest-Facility Concentration
Analytical Question
How many different healthcare facilities are identified as the nearest mapped facility for the 307 Critical settlements, and how concentrated are the settlement-to-facility relationships among those facilities?
Purpose
A7 examined the level, type, and distance characteristics of the healthcare facilities nearest to the 307 Critical settlements. A9 examines a different part of the same nearest-facility relationship: how many Critical settlements are linked to each nearest facility.
Several Critical settlements can have the same healthcare facility as their nearest mapped facility. Counting these relationships shows whether the 307 settlements are distributed across many nearest facilities or concentrated around a smaller number.
The analysis uses the facility identifier recorded in the nearest-facility results. It therefore measures the frequency with which each mapped facility occurs as the nearest facility among the 307 Critical settlements.
Input Data
A9 uses the 307 Critical settlements and their nearest healthcare facility identifiers retained from the earlier accessibility analysis.
Each settlement contributes one record to the analysis. Settlements sharing the same NEAR_FID are grouped together, allowing the number of Critical settlements associated with each nearest facility to be counted.
Method
A frequency analysis was performed on the NEAR_FID field for the complete set of 307 Critical settlements.
For each unique NEAR_FID, the number of associated Critical settlements was calculated. The resulting table contains one record for each healthcare facility appearing as a nearest facility within the Critical-settlement group.
The frequency values were then examined to identify the number of unique nearest facilities, the facilities associated with the largest numbers of Critical settlements, and the overall degree of concentration.
Critical Settlements by Nearest Healthcare Facility
The 307 Critical settlements are associated with 41 unique nearest healthcare facilities.
The number of Critical settlements associated with an individual facility varies considerably. Ten of the 41 facilities are associated with only one Critical settlement, while several facilities occur as the nearest facility for much larger groups.
Table A9-01 — Critical Settlements by Nearest Healthcare Facility
| NEAR_FID | FREQUENCY | COUNT_NEAR |
| 98 | 2 | 2 |
| 124 | 3 | 3 |
| 138 | 1 | 1 |
| 163 | 26 | 26 |
| 165 | 3 | 3 |
| 166 | 11 | 11 |
| 239 | 1 | 1 |
| 268 | 1 | 1 |
| 393 | 1 | 1 |
| 394 | 6 | 6 |
| 420 | 11 | 11 |
| 443 | 3 | 3 |
| 448 | 2 | 2 |
| 456 | 3 | 3 |
| 566 | 3 | 3 |
| 595 | 3 | 3 |
| 668 | 10 | 10 |
| 694 | 6 | 6 |
| 752 | 3 | 3 |
| 755 | 3 | 3 |
| 795 | 1 | 1 |
| 808 | 4 | 4 |
| 836 | 56 | 56 |
| 838 | 1 | 1 |
| 879 | 3 | 3 |
| 881 | 12 | 12 |
| 917 | 16 | 16 |
| 951 | 1 | 1 |
| 1003 | 1 | 1 |
| 1010 | 2 | 2 |
| 1037 | 4 | 4 |
| 1108 | 4 | 4 |
| 1112 | 1 | 1 |
| 1162 | 1 | 1 |
| 1163 | 2 | 2 |
| 1165 | 25 | 25 |
| 1298 | 33 | 33 |
| 1360 | 2 | 2 |
| 1428 | 7 | 7 |
| 1431 | 16 | 16 |
| 1524 | 13 | 13 |
The table contains the facility identifier (NEAR_FID) and the corresponding number of Critical settlements for which that facility is the nearest mapped healthcare facility.
Facilities with the Largest Critical-Settlement Groups
The strongest concentration occurs around NEAR_FID 836, which is the nearest mapped healthcare facility for 56 Critical settlements. This represents approximately 18.2% of all 307 Critical settlements.
The next largest groups are:
| NEAR_FID | Critical Settlements |
|---|---|
| 836 | 56 |
| 1298 | 33 |
| 163 | 26 |
| 1165 | 25 |
| 917 | 16 |
| 1431 | 16 |
These six facility IDs together account for 172 of the 307 Critical settlements, or approximately 56.0% of the Critical-settlement group.
The result shows that more than half of the Critical settlements have their nearest-facility relationship concentrated around only six of the 41 healthcare facilities represented in A9.
Wider Nearest-Facility Concentration
The concentration extends beyond the six largest groups.
Eleven facilities are each identified as the nearest facility for at least 10 Critical settlements. Together, these 11 facilities account for 229 of the 307 settlements, or approximately 74.6%.
At the other end of the distribution, 10 facilities are associated with only one Critical settlement each. The remaining facilities fall between these two ends of the frequency distribution.
The A9 results therefore show an uneven nearest-facility pattern. A relatively small number of mapped healthcare facilities account for a large share of the nearest-facility relationships among the Critical settlements.
A9 Key Results
| A9 Indicator | Result |
|---|---|
| Critical settlements analysed | 307 |
| Unique nearest healthcare facilities | 41 |
| Highest concentration | NEAR_FID 836 — 56 settlements |
| Share associated with NEAR_FID 836 | 18.2% |
| Second-highest concentration | NEAR_FID 1298 — 33 |
| Third-highest concentration | NEAR_FID 163 — 26 |
| Facilities with ≥10 Critical settlements | 11 |
| Settlements associated with those 11 facilities | 229 — 74.6% |
| Top 6 facilities | 172 — 56.0% |
| Facilities associated with only one Critical settlement | 10 |
Interpretation Boundary
A9 counts how often each mapped healthcare facility appears as the nearest facility in straight-line distance for the 307 Critical settlements.
A high frequency does not represent the number of patients using a facility, its service population, catchment area, workload, capacity, utilization, or demand. The analysis does not establish whether residents actually travel to or use the identified nearest facility.
NEAR_FID is the facility identifier used in the spatial analysis. The concentration results describe settlement-to-nearest-facility relationships, not healthcare facility utilization.
14 — A10: Road-Type Context
Analytical Question
What types of mapped roads are nearest to the 307 Critical settlements, and how does nearest-road distance vary among the recorded road classes?
Purpose
A6 measured the straight-line distance from each Critical settlement to its nearest mapped road. A10 examines the classification of those nearest roads.
The road class gives additional information about the road features occurring closest to the Critical settlements. The analysis shows whether the nearest roads are mainly residential roads, tracks, classified higher-order roads, or roads without a specific class in the source data.
Nearest-road distance is also summarized by road class. This allows the road-type distribution and the distance pattern to be examined together.
Input Data
A10 uses the 307 Critical settlements and the nearest-road results produced from the prepared road network dataset.
Each Critical settlement has one nearest mapped road and its corresponding road class. The straight-line distance to that road is retained from the road-proximity analysis.
All 307 Critical settlements are included in both A10 summaries.
Method
The road-class field of the nearest mapped road was summarized for the complete Critical-settlement dataset.
A frequency count was calculated for each recorded road class. Seven classes occur in the final results:
Residential, Secondary, Service, Tertiary, Track, Unclassified, and Unknown.
A second summary grouped the ROAD_DIST values by these same classes and calculated the mean, minimum, and maximum nearest-road distance for each group.
Nearest Road Class
Residential roads form the largest nearest-road group among the Critical settlements.
Table A10-01 — Nearest Road Class
| Nearest Road Class | Critical Settlements | Share |
|---|---|---|
| Residential | 160 | 52.1% |
| Unclassified | 86 | 28.0% |
| Track | 33 | 10.7% |
| Unknown | 24 | 7.8% |
| Secondary | 2 | 0.7% |
| Service | 1 | 0.3% |
| Tertiary | 1 | 0.3% |
| Total | 307 | 100.0% |
For 160 of the 307 Critical settlements, the nearest mapped road is classified as Residential. This represents approximately 52.1% of the complete Critical-settlement group.
Unclassified roads account for another 86 settlements, or 28.0%, while Tracks are nearest to 33 settlements, or 10.7%. The road class is Unknown for 24 settlements.
Secondary, Service, and Tertiary roads together account for only four nearest-road relationships.
Road Distance by Class
The second A10 table compares nearest-road distance across the seven road classes.
Table A10-02 — Road Distance by Class
| Road Class | Settlements | Mean Distance | Minimum | Maximum |
|---|---|---|---|---|
| Residential | 160 | 24.21 m | 0.01 m | 374.24 m |
| Secondary | 2 | 55.89 m | 37.28 m | 74.50 m |
| Service | 1 | 60.51 m | 60.51 m | 60.51 m |
| Tertiary | 1 | 16.44 m | 16.44 m | 16.44 m |
| Track | 33 | 54.67 m | 0.15 m | 403.12 m |
| Unclassified | 86 | 145.47 m | 0.21 m | 1,250.36 m |
| Unknown | 24 | 105.53 m | 3.75 m | 1,005.38 m |
Distance Pattern by Road Class
Residential roads have a mean nearest-road distance of approximately 24.21 m, substantially below the overall A6 mean of 68.11 m. The maximum distance within the Residential group is approximately 374.24 m.
Tracks have a mean distance of approximately 54.67 m, with values ranging from approximately 0.15 m to 403.12 m.
The largest mean distance occurs in the Unclassified group at approximately 145.47 m. This group also contains the largest individual nearest-road distance in A10, approximately 1,250.36 m.
The Unknown group has a mean distance of approximately 105.53 m and a maximum of approximately 1,005.38 m.
The Secondary, Service, and Tertiary groups contain only four settlements in total. Their mean distances therefore describe very small groups and should not be compared with the larger Residential, Unclassified, Track, and Unknown groups without considering the number of records.
Combined Road-Type Context
The two A10 summaries show that the nearest-road environment of the Critical settlements is dominated by Residential and Unclassified roads. Together, these two classes account for 246 of the 307 settlements, or approximately 80.1%.
Adding the 33 settlements associated with Tracks increases the combined total to 279 settlements, or approximately 90.9%.
Only four Critical settlements have Secondary, Service, or Tertiary roads recorded as their nearest mapped road.
The distance statistics also show that the larger nearest-road distances are concentrated mainly within the Unclassified and Unknown groups. Residential roads, despite accounting for more than half of all Critical settlements, have a much lower mean nearest-road distance.
A10 Key Results
| A10 Indicator | Result |
|---|---|
| Critical settlements analysed | 307 |
| Road classes represented | 7 |
| Residential | 160 — 52.1% |
| Unclassified | 86 — 28.0% |
| Track | 33 — 10.7% |
| Unknown | 24 — 7.8% |
| Secondary + Service + Tertiary | 4 — 1.3% |
| Residential + Unclassified | 246 — 80.1% |
| Residential + Unclassified + Track | 279 — 90.9% |
| Residential mean road distance | 24.21 m |
| Unclassified mean road distance | 145.47 m |
| Unknown mean road distance | 105.53 m |
| Largest recorded road distance | Unclassified — 1,250.36 m |
Interpretation Boundary
The road classes in A10 are the classifications recorded in the project road dataset. They describe the mapped road feature nearest to each Critical settlement and do not establish road condition, surface material, width, traffic capacity, maintenance status, ownership, or year-round usability.
The Unclassified and Unknown categories should also be kept distinct. Unclassified is a road class present in the source data, while Unknown represents records for which the road class used in this analysis is not available.
ROAD_DIST remains a straight-line geometric distance from the settlement point to the nearest mapped road. It does not measure road-network travel distance or travel time.
15 — Key Findings
Overall Findings
The analysis covered 26,833 settlement points across all 23 LGAs of Kaduna State and assessed their geographic relationship with 1,545 mapped healthcare facilities. Facility distribution, population-relative availability, settlement accessibility, underserved settlements and intervention priority were examined in sequence.
Healthcare accessibility was classified using straight-line distance from each settlement to the nearest mapped healthcare facility. 2,857 settlements, representing 10.65% of the analysed settlement points, were more than 5 km from the nearest mapped healthcare facility and were classified as underserved.
Within this underserved group, 2,418 settlements were classified as Limited, 432 as Poor and 7 as Very Poor. The Poor and Very Poor classes together contain 439 settlements located more than 10 km from the nearest mapped healthcare facility.
Geographic Concentration
Healthcare accessibility constraints are not evenly distributed across Kaduna State. Igabi, Chikun, Zangon Kataf and Birnin Gwari contain 326 of the 439 Poor and Very Poor settlements, representing 74.3% of the severely underserved group.
The seven Very Poor settlements are concentrated in only two LGAs. Six are located in Birnin Gwari and one in Chikun.
The LGA-level healthcare access assessment identified Igabi as the only Very High priority LGA, with an Access Priority score of 10. Four additional LGAs were classified as High priority.
Intervention Priority
The 2,857 underserved settlements were subsequently classified as Critical, Elevated or Watch using settlement accessibility and LGA healthcare access priority.
The final classification identified:
| Intervention Priority | Settlements | Share |
|---|---|---|
| Critical | 307 | 10.7% |
| Elevated | 1,655 | 57.9% |
| Watch | 895 | 31.3% |
| Total | 2,857 | 100.0% |
Critical settlements occur in five LGAs. Igabi contains 157, Chikun 62, Zangon Kataf 59, Kauru 28 and Kubau 1.
Igabi alone contains 51.1% of all Critical settlements. Igabi, Chikun and Zangon Kataf together contain 278 of the 307 Critical settlements, or 90.6%.
307 Critical Settlements
The A6–A10 analyses examined the Critical settlements in greater detail.
Road proximity results show that 297 of the 307 Critical settlements (96.7%) are within 500 m of a mapped road. Only 10 exceed 500 m, including five that exceed 1 km. Nine of the 10 settlements beyond 500 m are located in Igabi.
All 307 Critical settlements have a Primary-level healthcare facility as their nearest mapped healthcare facility. Primary Health Centers account for 129 nearest-facility relationships and Primary Health Clinics for 115. Together they account for 244 of the 307 relationships, or 79.5%.
The 307 settlements are associated with 41 unique nearest healthcare facilities. The distribution is concentrated: 11 facilities are each the nearest mapped facility for at least 10 Critical settlements and together account for 229 settlements, or 74.6% of the Critical group.
Population and Road Context
Population normalization shows that Igabi has both the largest absolute Critical-settlement count and the highest population-relative rate among the five LGAs containing Critical settlements: 157 settlements and approximately 11.65 Critical settlements per 100,000 population.
Zangon Kataf follows closely on the population-relative measure at approximately 11.52 per 100,000, despite having 59 Critical settlements compared with Chikun’s 62.
The nearest-road analysis shows that Residential roads are nearest to 160 Critical settlements (52.1%), followed by Unclassified roads for 86 and Tracks for 33. Residential and Unclassified roads together account for 246 of the 307 Critical settlements (80.1%).
Main Result
The study identified a relatively small but geographically concentrated group of settlements with the strongest healthcare-accessibility constraints within the analytical framework.
From 26,833 settlement points, the analysis identified 2,857 underserved settlements and subsequently narrowed this group to 307 Critical settlements. Most of these Critical settlements are concentrated in Igabi, Chikun and Zangon Kataf.
The supporting A6–A10 results also show that poor healthcare accessibility and road proximity are not the same condition. Most Critical settlements are geographically close to a mapped road, while their nearest mapped healthcare facilities remain sufficiently distant to place them within the Critical classification established in A5.
Related GIS Services: GIS Mapping & Cartography · Spatial Data Processing & Analysis · GIS Data QA/QC
16 — Limitations & Interpretation
Scope of Interpretation
This case study is a GIS-based spatial accessibility assessment using mapped healthcare facilities, populated settlements, administrative boundaries, population data and road-network data for Kaduna State.
The results describe geographic relationships within the datasets used in the analysis. They identify differences in facility distribution, settlement-to-facility distance, population-relative facility availability, underserved settlements and the spatial concentration of intervention-priority groups.
The analysis is intended for spatial screening and comparative assessment. It does not represent a complete evaluation of healthcare provision or healthcare need.
Healthcare Facility Data
The healthcare facility analysis is based on the 1,545 mapped facilities retained in the prepared project dataset. Facility locations, levels, types and ownership classifications reflect the information recorded in the source data.
The analysis does not confirm the current operating status of individual facilities. It also does not assess staffing, medical specialties, available services, opening hours, equipment, bed capacity, medicine availability, patient load or quality of care.
A mapped healthcare facility should therefore be interpreted as a facility represented in the project dataset, not as confirmation that a particular level of healthcare service was available at that location when the analysis was carried out.
Settlement Representation
The accessibility analysis uses 26,833 settlement points as the geographic representation of populated settlements.
Each settlement is represented by a point location for distance analysis. The point does not describe the full spatial extent of the settlement, the distribution of households within it or the location of every resident.
The A4 underserved-settlement percentage and the A5 intervention-priority counts refer to settlement points, not population totals. For example, the 2,857 underserved settlements represent 10.65% of the analysed settlement points; this should not be interpreted as 10.65% of Kaduna State’s population.
Distance-Based Accessibility
Healthcare accessibility is measured using straight-line distance from each settlement point to the nearest mapped healthcare facility.
The distance classes used in the study are:
| Accessibility Class | Distance |
|---|---|
| Very Good | ≤ 2 km |
| Good | > 2–5 km |
| Limited | > 5–10 km |
| Poor | > 10–20 km |
| Very Poor | > 20 km |
These classes provide a consistent spatial classification for this case study. They are analytical thresholds used within the project and are not presented as universal healthcare-accessibility standards.
Straight-line distance does not account for the actual route travelled between a settlement and a healthcare facility. Rivers, terrain, road connectivity, road condition, seasonal restrictions and other physical barriers may affect actual travel.
Population-Based Indicators
Population values are used at LGA level in the population-relative analyses.
A2 compares mapped healthcare facility counts with LGA population through facilities per 100,000 population and population per healthcare facility. A8 compares Critical-settlement counts with LGA population through Critical settlements per 100,000 population.
These indicators allow LGAs of different population sizes to be compared using a common denominator. They do not assign population directly to individual settlement points and do not estimate the number of people living within underserved or Critical settlements.
Road-Network Interpretation
A6 and A10 use the prepared road dataset to examine the nearest mapped road associated with each of the 307 Critical settlements.
ROAD_DIST is a straight-line geometric distance from the settlement point to the nearest mapped road. It is not road-network travel distance.
The road analysis does not assess surface condition, width, traffic capacity, connectivity, maintenance status, seasonal passability, vehicle availability, public transport or travel time. A settlement located close to a mapped road cannot therefore be assumed to have good practical transport access.
The 500 m and 1 km screening values used in A6 describe the road-distance distribution within the Critical-settlement group. They are not transport or infrastructure planning standards.
Intervention Priority
The Critical, Elevated and Watch categories are classifications developed for this case study.
They combine the settlement healthcare-accessibility class with the LGA Healthcare Access Priority established earlier in the analysis. The resulting categories allow the 2,857 underserved settlements to be separated according to the rules defined in A5.
The classification is not an official government designation and does not establish funding priority, facility construction requirements or healthcare policy. The 307 Critical settlements identify locations with the strongest combined conditions under the study rules and are suitable for further assessment before any planning decision is made.
Nearest-Facility Relationships
A7 and A9 examine the healthcare facility identified as nearest to each Critical settlement.
The nearest facility is determined by straight-line geographic distance. The analysis does not establish whether residents use that facility, whether they prefer another facility, or whether the nearest facility provides the services required by the settlement population.
Similarly, the A9 concentration analysis does not measure facility catchment population, patient volume or workload. It counts how frequently a mapped healthcare facility appears as the nearest facility among the 307 Critical settlements.
Use of the Results
The results can be used to identify locations for more detailed investigation. The maps, classifications and tables show where geographic healthcare-accessibility constraints occur within the datasets and where those constraints are concentrated.
Before the results are used for healthcare investment or facility-location decisions, the identified areas would require additional information such as current facility status and capacity, settlement population, healthcare demand, road-network travel time, transport conditions, service availability and field verification.
The case study therefore remains a spatial screening and prioritization analysis. Its results identify geographic patterns and candidate areas for further assessment; they do not replace detailed healthcare planning or local verification.
17 — Conclusion
This case study examined geographic access to mapped healthcare facilities across Kaduna State using healthcare facility locations, populated settlements, LGA population, administrative boundaries and road-network data.
The analysis covered 26,833 settlement points and 1,545 mapped healthcare facilities across 23 LGAs. Facility distribution and population-relative availability were examined first, followed by settlement-level healthcare accessibility and LGA access priority.
The settlement accessibility analysis identified 2,857 underserved settlements located more than 5 km from the nearest mapped healthcare facility. These comprise 2,418 Limited, 432 Poor and 7 Very Poor settlements.
The A5 intervention-priority assessment classified the underserved settlements into 307 Critical, 1,655 Elevated and 895 Watch settlements.
Geographic Focus of the Results
The Critical settlements are concentrated in five LGAs: Igabi, Chikun, Zangon Kataf, Kauru and Kubau.
Igabi contains 157 Critical settlements, representing 51.1% of the statewide Critical total. Chikun contains 62 and Zangon Kataf 59. Together, these three LGAs contain 278 of the 307 Critical settlements, or 90.6%.
The population-relative analysis also places Igabi and Zangon Kataf at the upper end among the five Critical-settlement LGAs, with approximately 11.65 and 11.52 Critical settlements per 100,000 population, respectively.
Critical-Settlement Context
The A6–A10 analyses examined the 307 Critical settlements beyond the intervention-priority classification.
Road-distance results show that 297 Critical settlements, or 96.7%, are within 500 m of a mapped road. This indicates that the healthcare-accessibility pattern identified in A5 is generally not associated with large straight-line distances from the mapped road network.
All 307 Critical settlements have a Primary-level facility as their nearest mapped healthcare facility. Primary Health Centers and Primary Health Clinics account for 244 of the 307 nearest-facility relationships.
The nearest-facility analysis identified 41 unique healthcare facilities associated with the 307 Critical settlements. Eleven of these facilities are each the nearest mapped facility for at least 10 Critical settlements and together account for 229 settlements.
Residential roads are nearest to 160 Critical settlements, followed by Unclassified roads for 86 and Tracks for 33. These three road classes account for 279 of the 307 Critical settlements.
What the Study Shows
The analysis identifies where settlement-level geographic healthcare-accessibility constraints occur within Kaduna State and where the more severe conditions are concentrated.
The results also show why several spatial measures are needed. Facility counts alone do not describe population-relative availability. LGA-level indicators do not show the location of individual underserved settlements. Healthcare-facility distance does not describe road proximity, and road proximity does not establish practical transport access.
Using these measures together produced a sequence from statewide facility distribution to individual Critical settlements and their local healthcare and road context.
Application of the Results
The 307 Critical settlements provide a focused set of locations for further investigation. The results can support more detailed work using current facility operating information, settlement population, road-network travel time, facility capacity, service availability and field verification.
The same analytical structure can also be repeated when updated healthcare facility, population, settlement or road data become available. The classifications and calculations are defined explicitly, allowing later results to be compared with the current analysis where the input datasets remain compatible.
The study does not prescribe new healthcare facility locations or investment decisions. Those decisions require information beyond the spatial datasets used here. The results identify where further assessment can be concentrated.
18 — Technical Scope & Interpretation Boundary
This case study is a GIS-based analytical demonstration developed from publicly available spatial datasets. The results reflect the geographic relationships represented by those datasets and the analytical rules defined within the study.
Healthcare-facility proximity does not by itself measure healthcare service availability, facility capacity, staffing, quality of care or health outcomes. Similarly, proximity to a mapped road does not establish actual travel time, road condition, transport availability or year-round accessibility.
The intervention-priority classifications therefore represent relative geographic screening categories, not recommendations for construction of new healthcare facilities or allocation of healthcare investment.
More detailed planning would require additional information including current facility operating status, service capacity, settlement population, verified transport networks, travel-time analysis, local accessibility conditions and field validation.
Within these boundaries, the study provides a reproducible spatial framework for identifying underserved settlements, examining the geographic context of the highest-priority locations and directing subsequent investigation toward a clearly defined set of areas.
Study Area: Kaduna State, Nigeria
Analytical Coverage: 23 LGAs
Settlement Points Analysed: 26,833
Mapped Healthcare Facilities: 1,545
Underserved Settlements: 2,857
Critical Settlements Found: 307